Weekly ReportReport Settimanale
A read on the crypto market — analysis, on-chain data, sectors and news for the week.Una lettura del mercato crypto — analisi, dati on-chain, settori e news della settimana.
ContentsIndice
01
Weekly SummarySintesi della settimana
The crypto market closed a week of consolidation, with BTC slightly down at -0.59% and total market cap around $2.57T.Il mercato crypto ha chiuso una settimana di consolidamento, con BTC in lieve calo a -0.59% e una capitalizzazione complessiva del mercato intorno ai $2.57T.
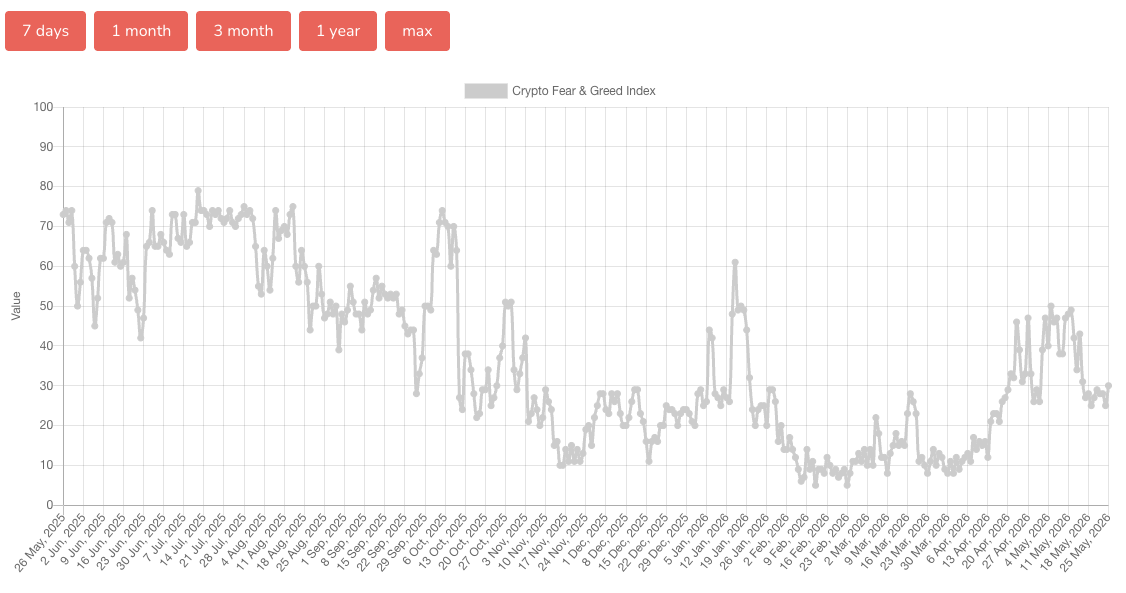
Sentiment stays cautious: the Fear & Greed Index sits at 30, still in fear territory, signalling a market far from full risk-on.Il sentiment rimane prudente: il Fear & Greed Index è a 30, ancora in area fear, segnalando un mercato lontano da una fase di pieno risk-on.
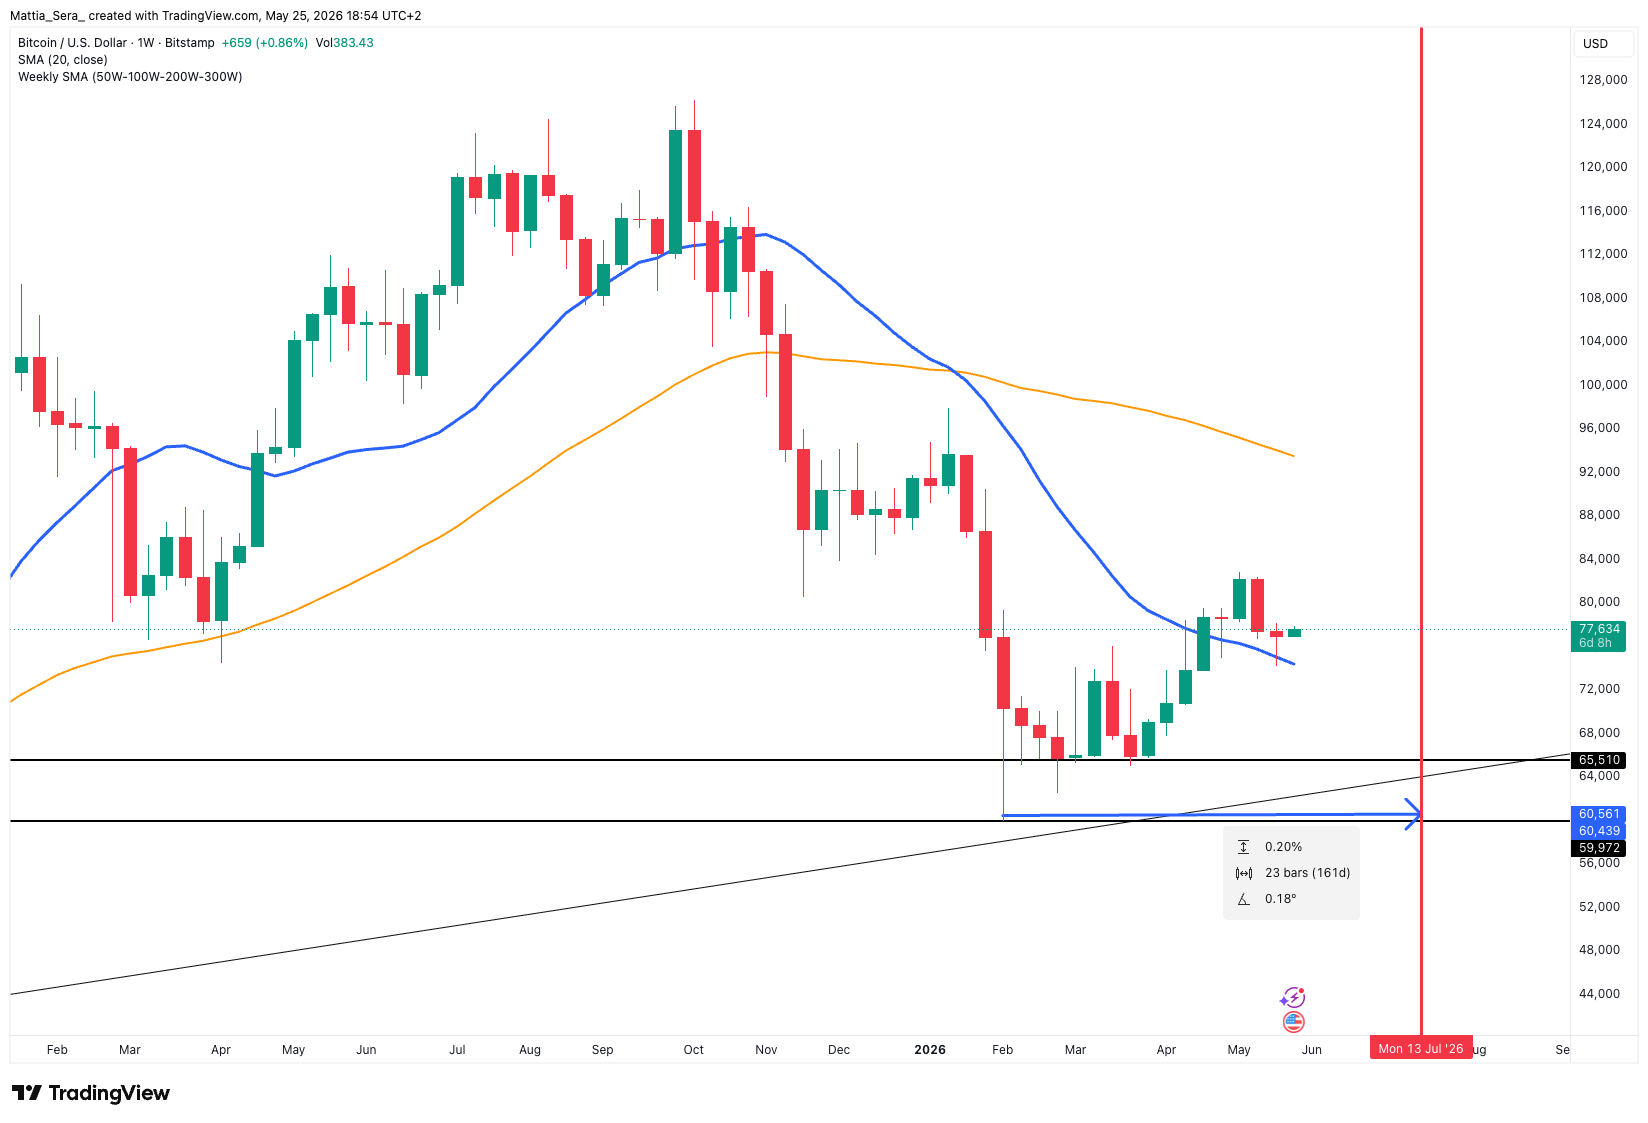
At the same time, BTC is above its 20-week moving average for the fifth week in a row — worth watching: historically, in bear markets, price tends not to stay above this average for long.Allo stesso tempo, BTC si trova per la quinta settimana consecutiva sopra la media mobile a 20 settimane, un elemento da monitorare con attenzione: storicamente, nelle fasi di bear market, il prezzo tende a non restare a lungo sopra questa media.
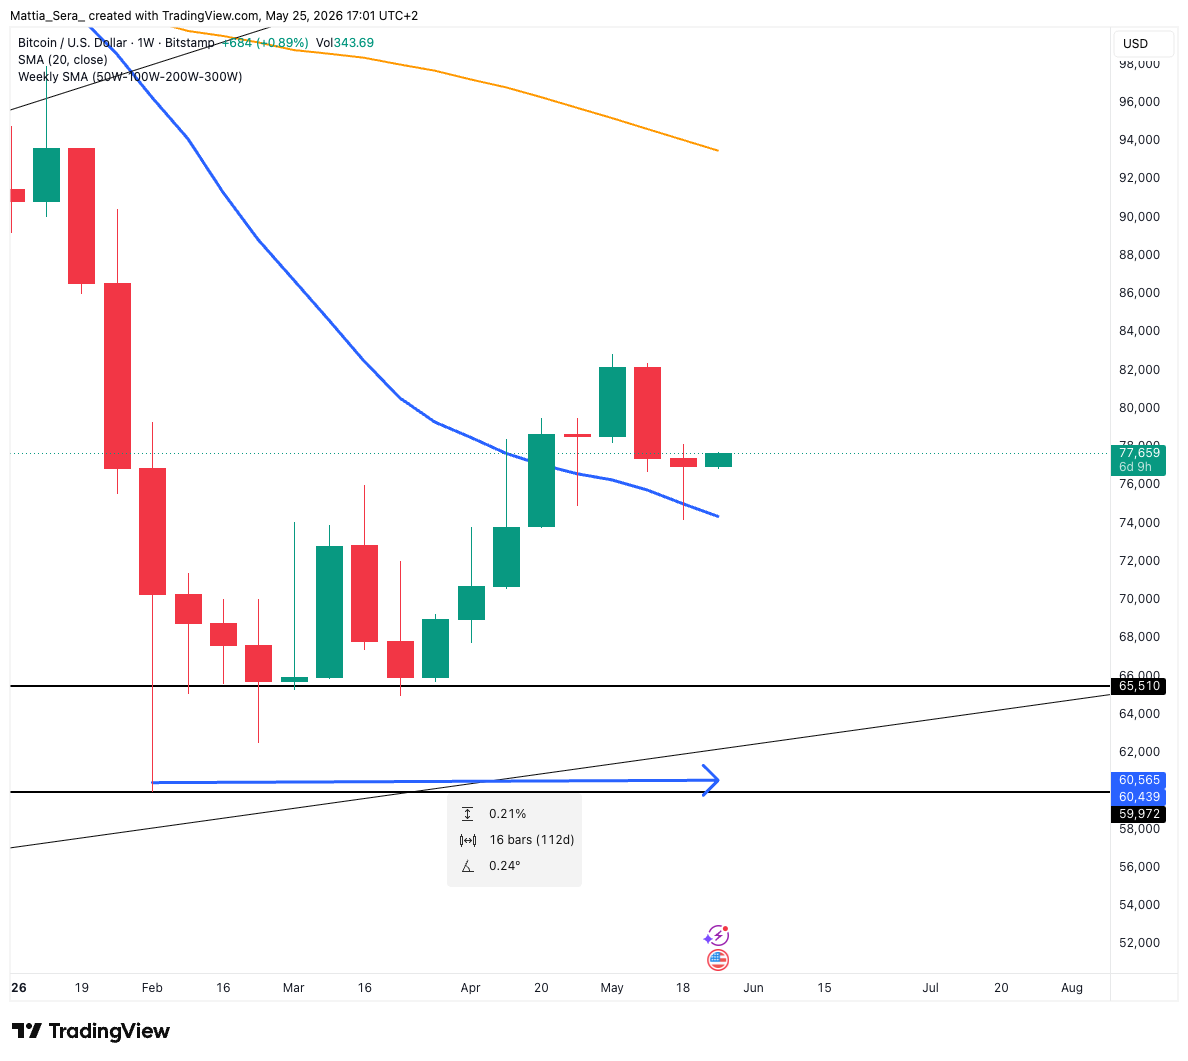
The structure stays sideways. About 112 days have passed since the 2 February low around $59K. Bitcoin's weekly volumes are around $160B, in line with recent weeks — still meaningful participation but no clear bullish acceleration.La struttura rimane laterale. Sono passati circa 112 giorni dal minimo del 2 febbraio in area $59K. I volumi settimanali di Bitcoin si attestano intorno ai $160B, in linea con le scorse settimane, confermando una partecipazione ancora significativa ma senza un chiaro segnale di accelerazione rialzista.
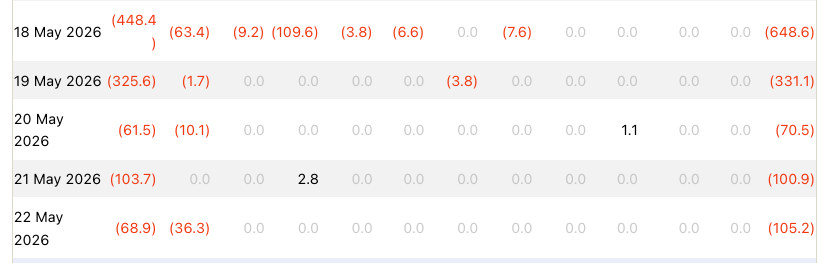
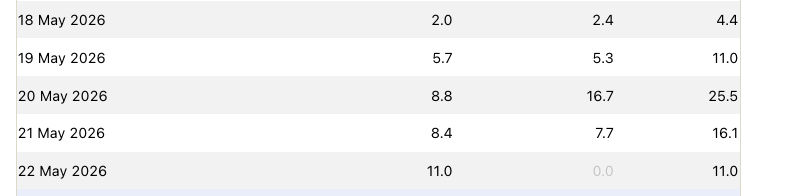
On the ETF side, the week was negative: Bitcoin ETFs saw about $1.26B of net outflows, Ethereum ETFs about $216M. HYPE, on the other hand, keeps attracting capital, confirming itself among the most resilient assets in this phase.Sul fronte ETF, la settimana è stata negativa: gli ETF Bitcoin hanno registrato circa $1.26B di deflussi netti, mentre gli ETF Ethereum hanno visto circa $216M di deflussi. Al contrario, HYPE continua ad attirare capitale, confermandosi tra gli asset più resilienti del mercato crypto in questa fase.
02
Market OverviewPanoramica di mercato
- Crypto Total Market Cap$2.57T
- BTC Market Cap$1.56T
- BTC Weekly PerformancePerformance settimanale BTC-0.59%
- BTC volumes (week of 11 May)Volumi BTC (settimana 11 maggio)$160B
- BTC dominance60.6%
- ETH dominance10%
- Fear & Greed Index30
03
BTC Analysis & OutlookAnalisi BTC & Outlook
The picture is very similar to last week: BTC is still inside the bullish impulse that began in early February, now running for about 112 days.La situazione rimane molto simile alla scorsa settimana: BTC si trova ancora all'interno dell'impulso rialzista iniziato a inizio febbraio, che dura ormai da circa 112 giorni.
The view stays cautious. The move is still positive short-term, but we think we're in the final phase of this impulse. The main scenario remains a possible new low, below the $60K area, within the next 30–40 days — so between late June and early July.La view rimane prudente. Il movimento resta positivo nel breve periodo, ma secondo noi siamo nella fase finale di questo impulso. Lo scenario principale rimane la possibilità di vedere un nuovo minimo, inferiore all'area $60K, entro i prossimi 30-40 giorni, quindi tra fine giugno e inizio luglio.
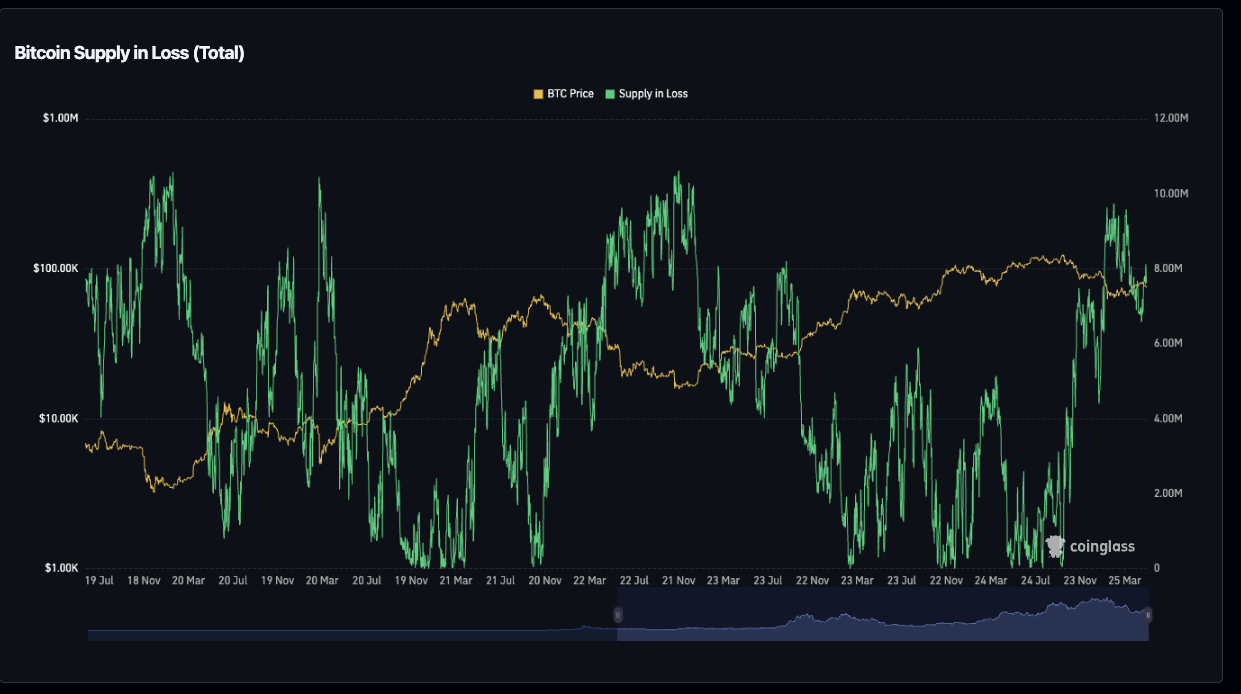
One thing to watch is supply in loss. For now it's still relatively contained versus previous bear markets: this doesn't mean BTC must reach the same stress levels of past cycles, but as long as the structure stays closely aligned with prior bear markets, we still consider a return toward the $60K area plausible.Un elemento da monitorare è la supply in perdita. Al momento è ancora relativamente contenuta rispetto ai bear market precedenti: questo non significa che BTC debba necessariamente raggiungere gli stessi livelli di stress visti nei cicli passati, ma finché la struttura rimane molto allineata ai precedenti bear market, continuiamo a considerare plausibile un ritorno verso area $60K.
Otherwise, if BTC fails to make new lows by mid-July and manages to hold above the 20-week moving average, the picture would start to change — an important sign of stabilisation.Nel caso contrario, se BTC non dovesse segnare nuovi minimi entro la prima metà di luglio e riuscisse a rimanere sopra la media mobile a 20 settimane, il quadro inizierebbe a cambiare. Sarebbe un importante segnale di stabilizzazione.
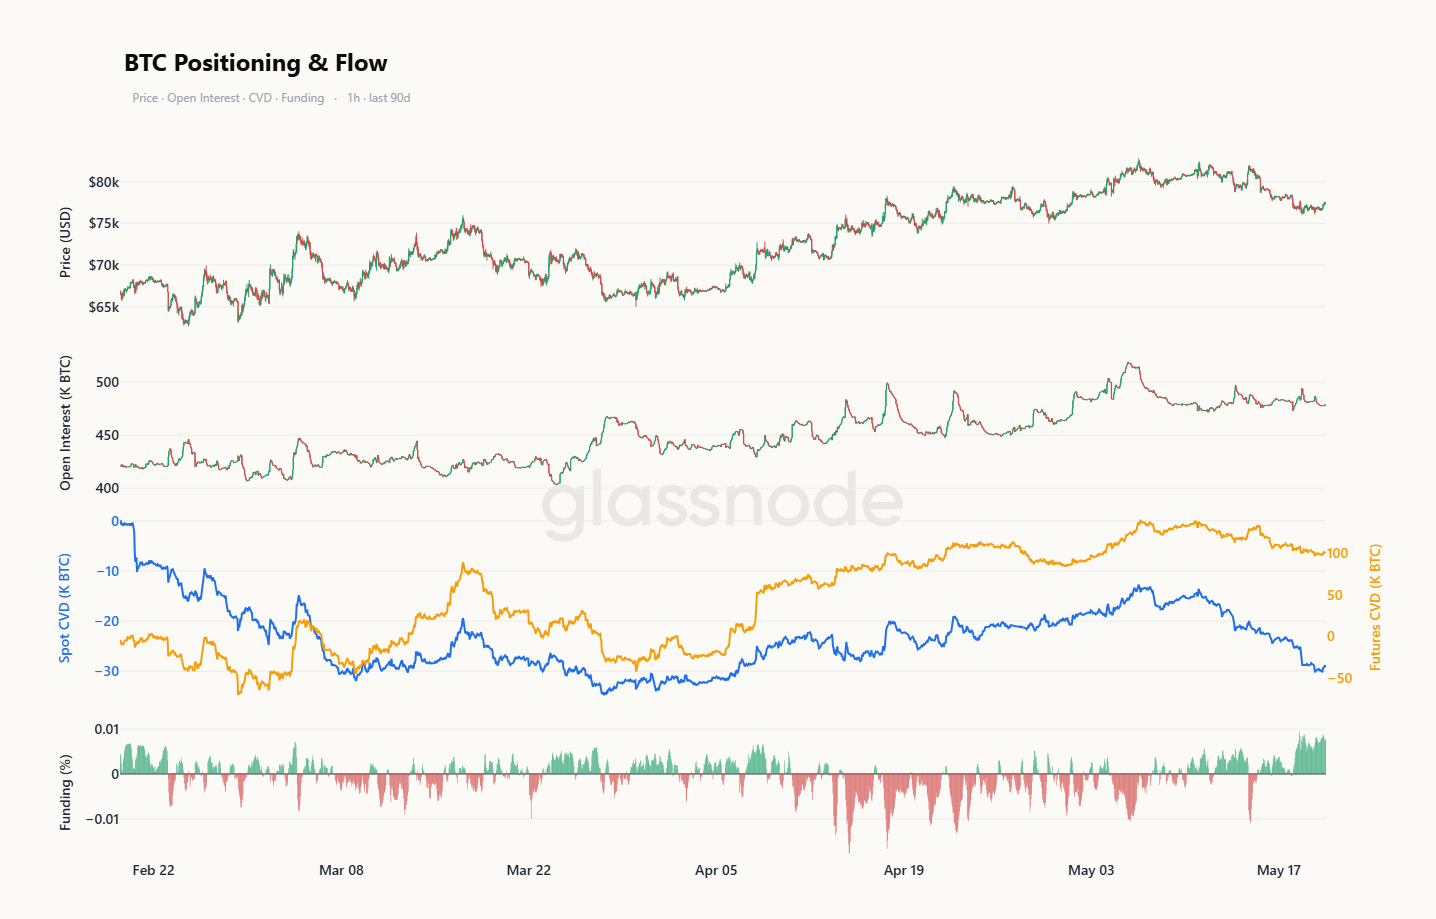
The Positioning & Flows chart also confirms a fragile structure: open interest still elevated, positive funding and weak Spot CVD. The market looks more supported by leverage than by strong spot demand, raising the risk of a reset before a more solid restart.Anche dal grafico Positioning & Flows si conferma una struttura fragile: open interest ancora elevato, funding positivo e Spot CVD debole. Il mercato sembra quindi più sostenuto dalla leva che da una domanda spot forte, aumentando il rischio di un reset prima di una ripartenza più solida.
04
On-chainOn-chain
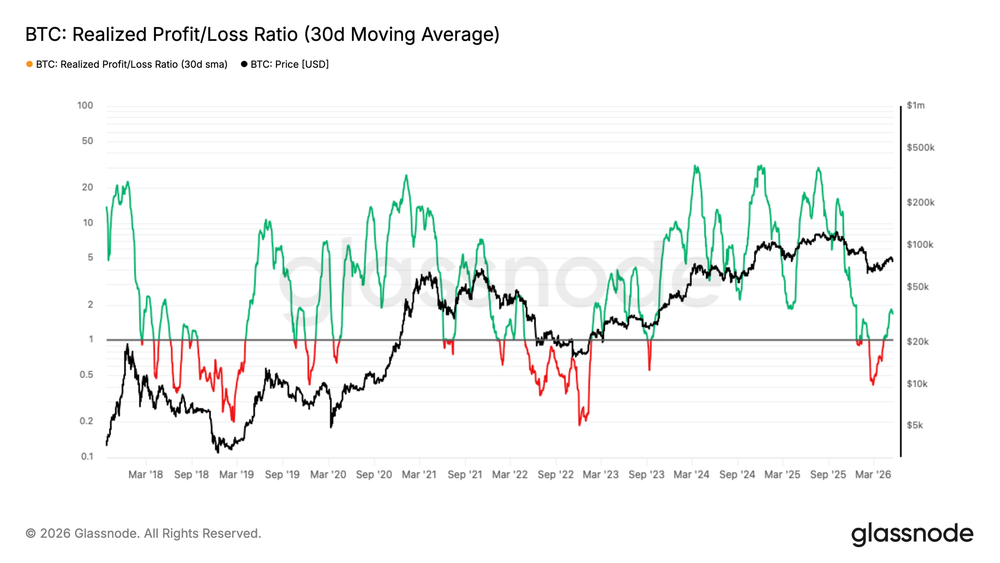
The Realized Profit/Loss Ratio (30d SMA) rose from 0.5 to 1.8, signalling a sharp rise in profit-taking during the bounce. In other words, many investors used BTC's recovery to exit or reduce exposure.Il Realized Profit/Loss Ratio (30d SMA) è salito da 0.5 a 1.8, segnalando un forte aumento delle prese di profitto durante il rimbalzo. In altre parole, molti investitori hanno sfruttato la risalita di BTC per uscire o ridurre esposizione.
This shows demand is present, but not yet strong enough to convincingly absorb the distribution. For a real regime change, we'd need the ratio to stabilise above 2 for more than 2 weeks — a sign the market can handle profit-taking without losing momentum. Until that happens, the rally stays fragile.Questo dato mostra che la domanda è presente, ma non ancora abbastanza forte da assorbire in modo convincente la distribuzione. Per parlare di un vero cambio di regime, servirebbe una stabilizzazione del ratio sopra 2 per più di 2 settimane, segnale che il mercato riesce a reggere le prese di profitto senza perdere momentum. Finché questo non accade, il rally rimane fragile.
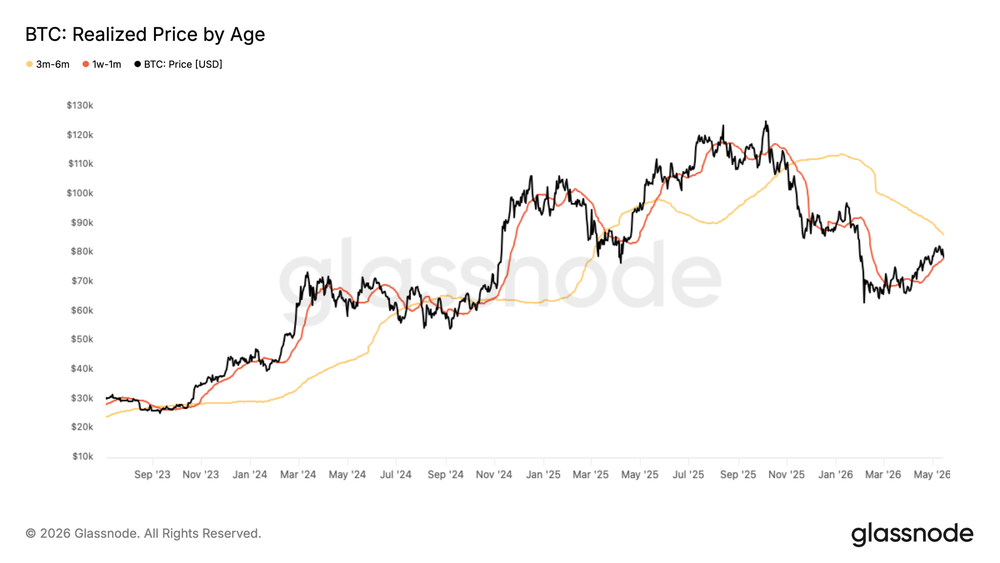
The Realized Price by Age shows the cost basis of the different investor cohorts. Accumulators of the last 30 days have a cost basis around $78.2K — now slightly in loss, so this zone can turn into local resistance: on a return toward those levels, many could sell to break even.Il Realized Price by Age ci mostra il cost basis delle diverse coorti di investitori. Gli accumulatori degli ultimi 30 giorni hanno un cost basis in area $78.2K: ora sono leggermente in perdita e questa zona può trasformarsi in una resistenza locale: in caso di ritorno verso quei livelli, molti potrebbero vendere per uscire in pari.
Looking at the 3–6 month cohort, the cost basis is higher, around $88K — an important medium-term level: a return above it would show BTC is recovering the average cost of more "structural" investors too. In short, $78K is the first resistance to reclaim, while $88K is the next level to break to strengthen the medium-term picture.Guardando invece la coorte 3-6 mesi, il cost basis si trova più in alto, in area $88K: resta un livello importante per il medio periodo: un ritorno sopra questa fascia indicherebbe che BTC sta recuperando anche il prezzo medio di carico degli investitori più "strutturali". In sintesi, $78K è la prima resistenza da riconquistare, mentre $88K rappresenta il livello successivo da superare per rafforzare il quadro di medio periodo.
05
Sectors to WatchSettori da monitorare
Over the last week, capital showed an interesting rotation toward Privacy coins and AI. Privacy tokens posted about +24%, while the AI sector rose about +20%, showing relative strength versus the rest of the market.Nell'ultima settimana, il capitale ha mostrato una rotazione interessante verso Privacy coins e AI. I privacy tokens hanno registrato una performance di circa +24%, mentre il settore AI è cresciuto di circa +20%, mostrando forza relativa rispetto al resto del mercato.
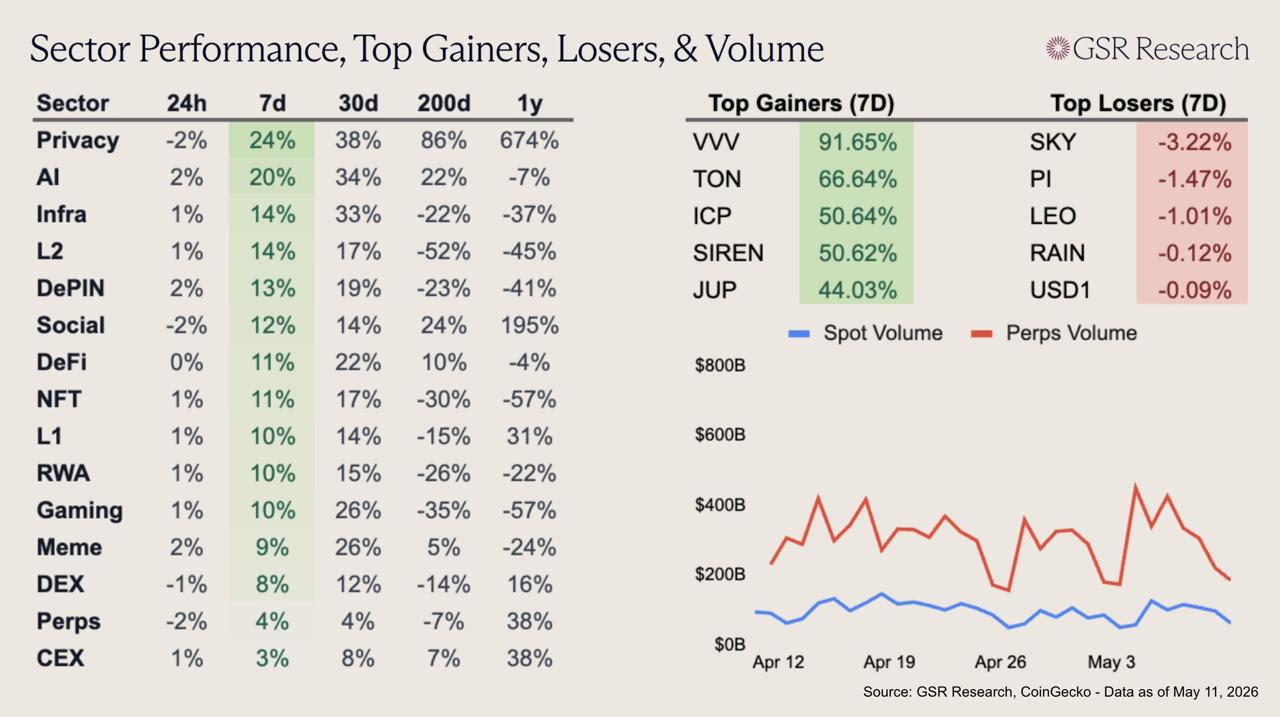
Among the main drivers are assets like ZEC, XMR, Venice and ICP. On a medium-term view too, the Privacy sector shows very strong performance, about +86% over the last 200 days. For now we don't yet see it as a structural trend like stablecoins or RWA, but more a market rotation to monitor: when the market stays sideways and selective, capital concentrates on the narratives showing relative strength.Tra i principali driver troviamo asset come ZEC, XMR, Venice e ICP. Guardando anche al medio periodo, il settore Privacy mostra una performance molto forte, con circa +86% negli ultimi 200 giorni. In questa fase non lo consideriamo ancora un trend strutturale come stablecoin o RWA, ma più una rotazione di mercato da monitorare: quando il mercato resta laterale e selettivo, il capitale tende a concentrarsi sulle narrative che mostrano forza relativa.
Worth noting is VVV, the token of Venice AI — a private alternative to ChatGPT that lets you generate text, images and code without the platform logging or selling user data, using uncensored open-source models. The interesting part is the economics: every new subscription triggers an automatic buyback & burn of $2 of VVV from the market. More users → more burn, less supply, higher potential price pressure. According to reported data, the mechanism has already destroyed about 42% of total supply.Da notare il caso VVV, token di Venice AI — un'alternativa privata a ChatGPT che permette di generare testo, immagini e codice senza che la piattaforma logghi o venda i dati degli utenti, usando modelli open-source non censurati. Il punto interessante è il meccanismo economico: ogni nuova sottoscrizione genera un buyback & burn automatico di $2 di VVV dal mercato. Più utenti → più burn, meno supply, maggiore pressione potenziale sul prezzo. Secondo i dati riportati, il meccanismo ha già distrutto circa il 42% della supply totale.
Stablecoins & on-chain paymentsStablecoin & pagamenti on-chain
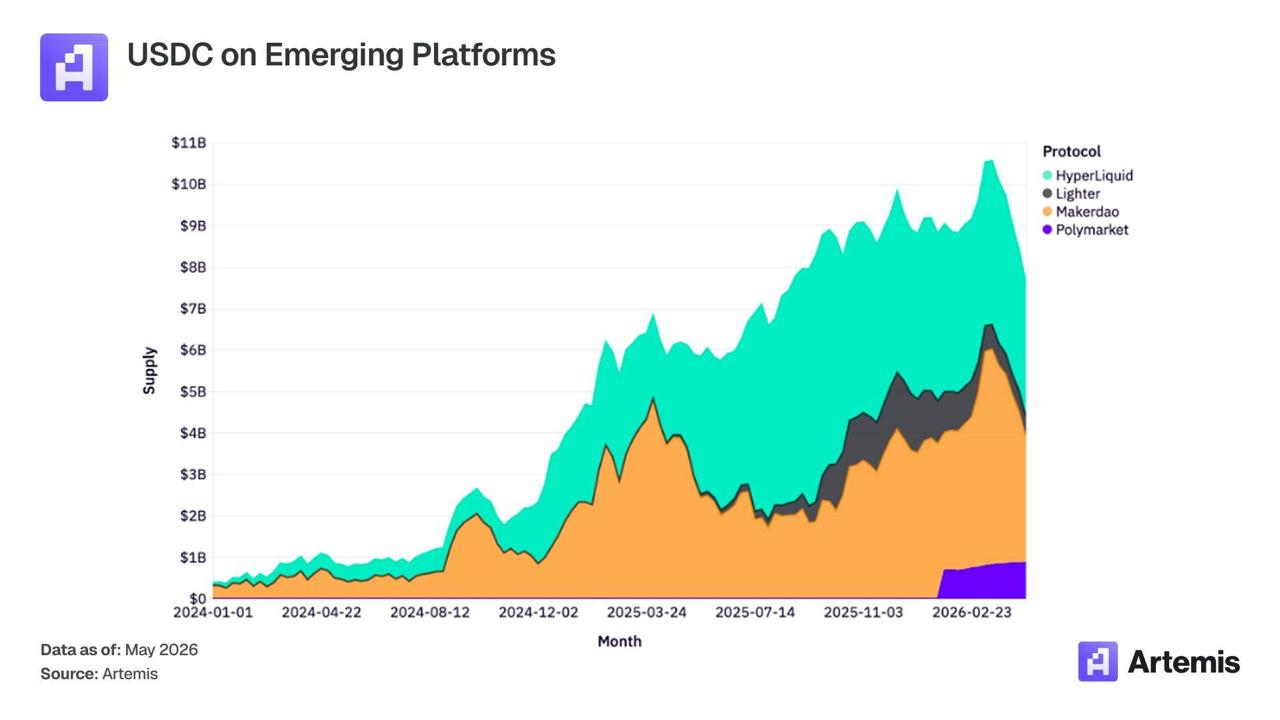
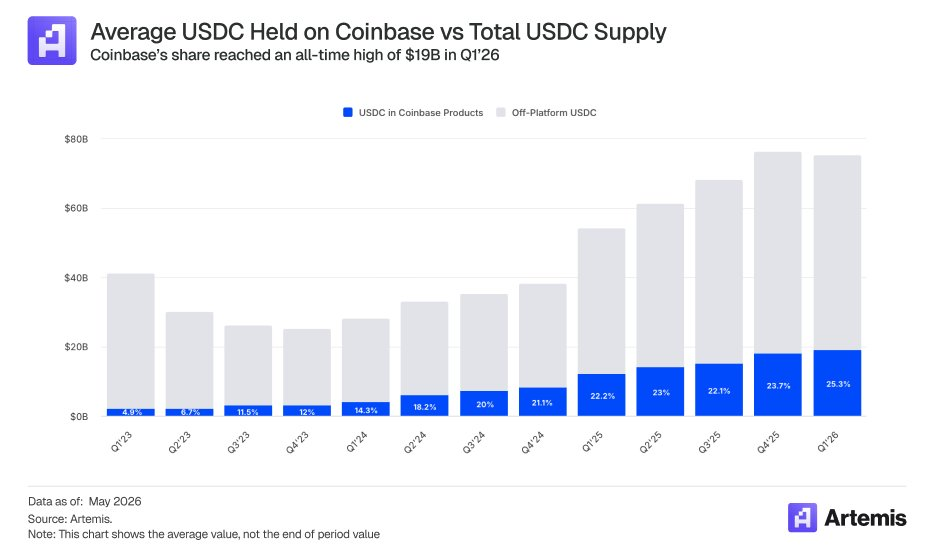
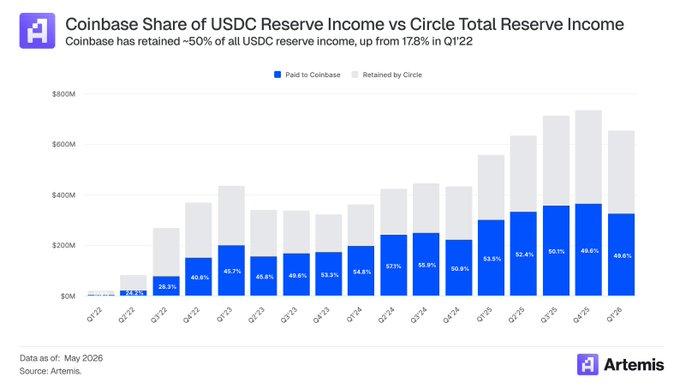
The stablecoin theme remains one of the strongest in the market. One relevant data point is the growth of USDC as a settlement layer for various on-chain applications: more and more protocols use USDC as the base asset for payments, trading, collateral and operational liquidity.Il tema stablecoin continua a essere uno dei più forti del mercato. Un dato rilevante è la crescita di USDC come layer di settlement per diverse applicazioni on-chain: sempre più protocolli usano USDC come asset base per pagamenti, trading, collateral e liquidità operativa.
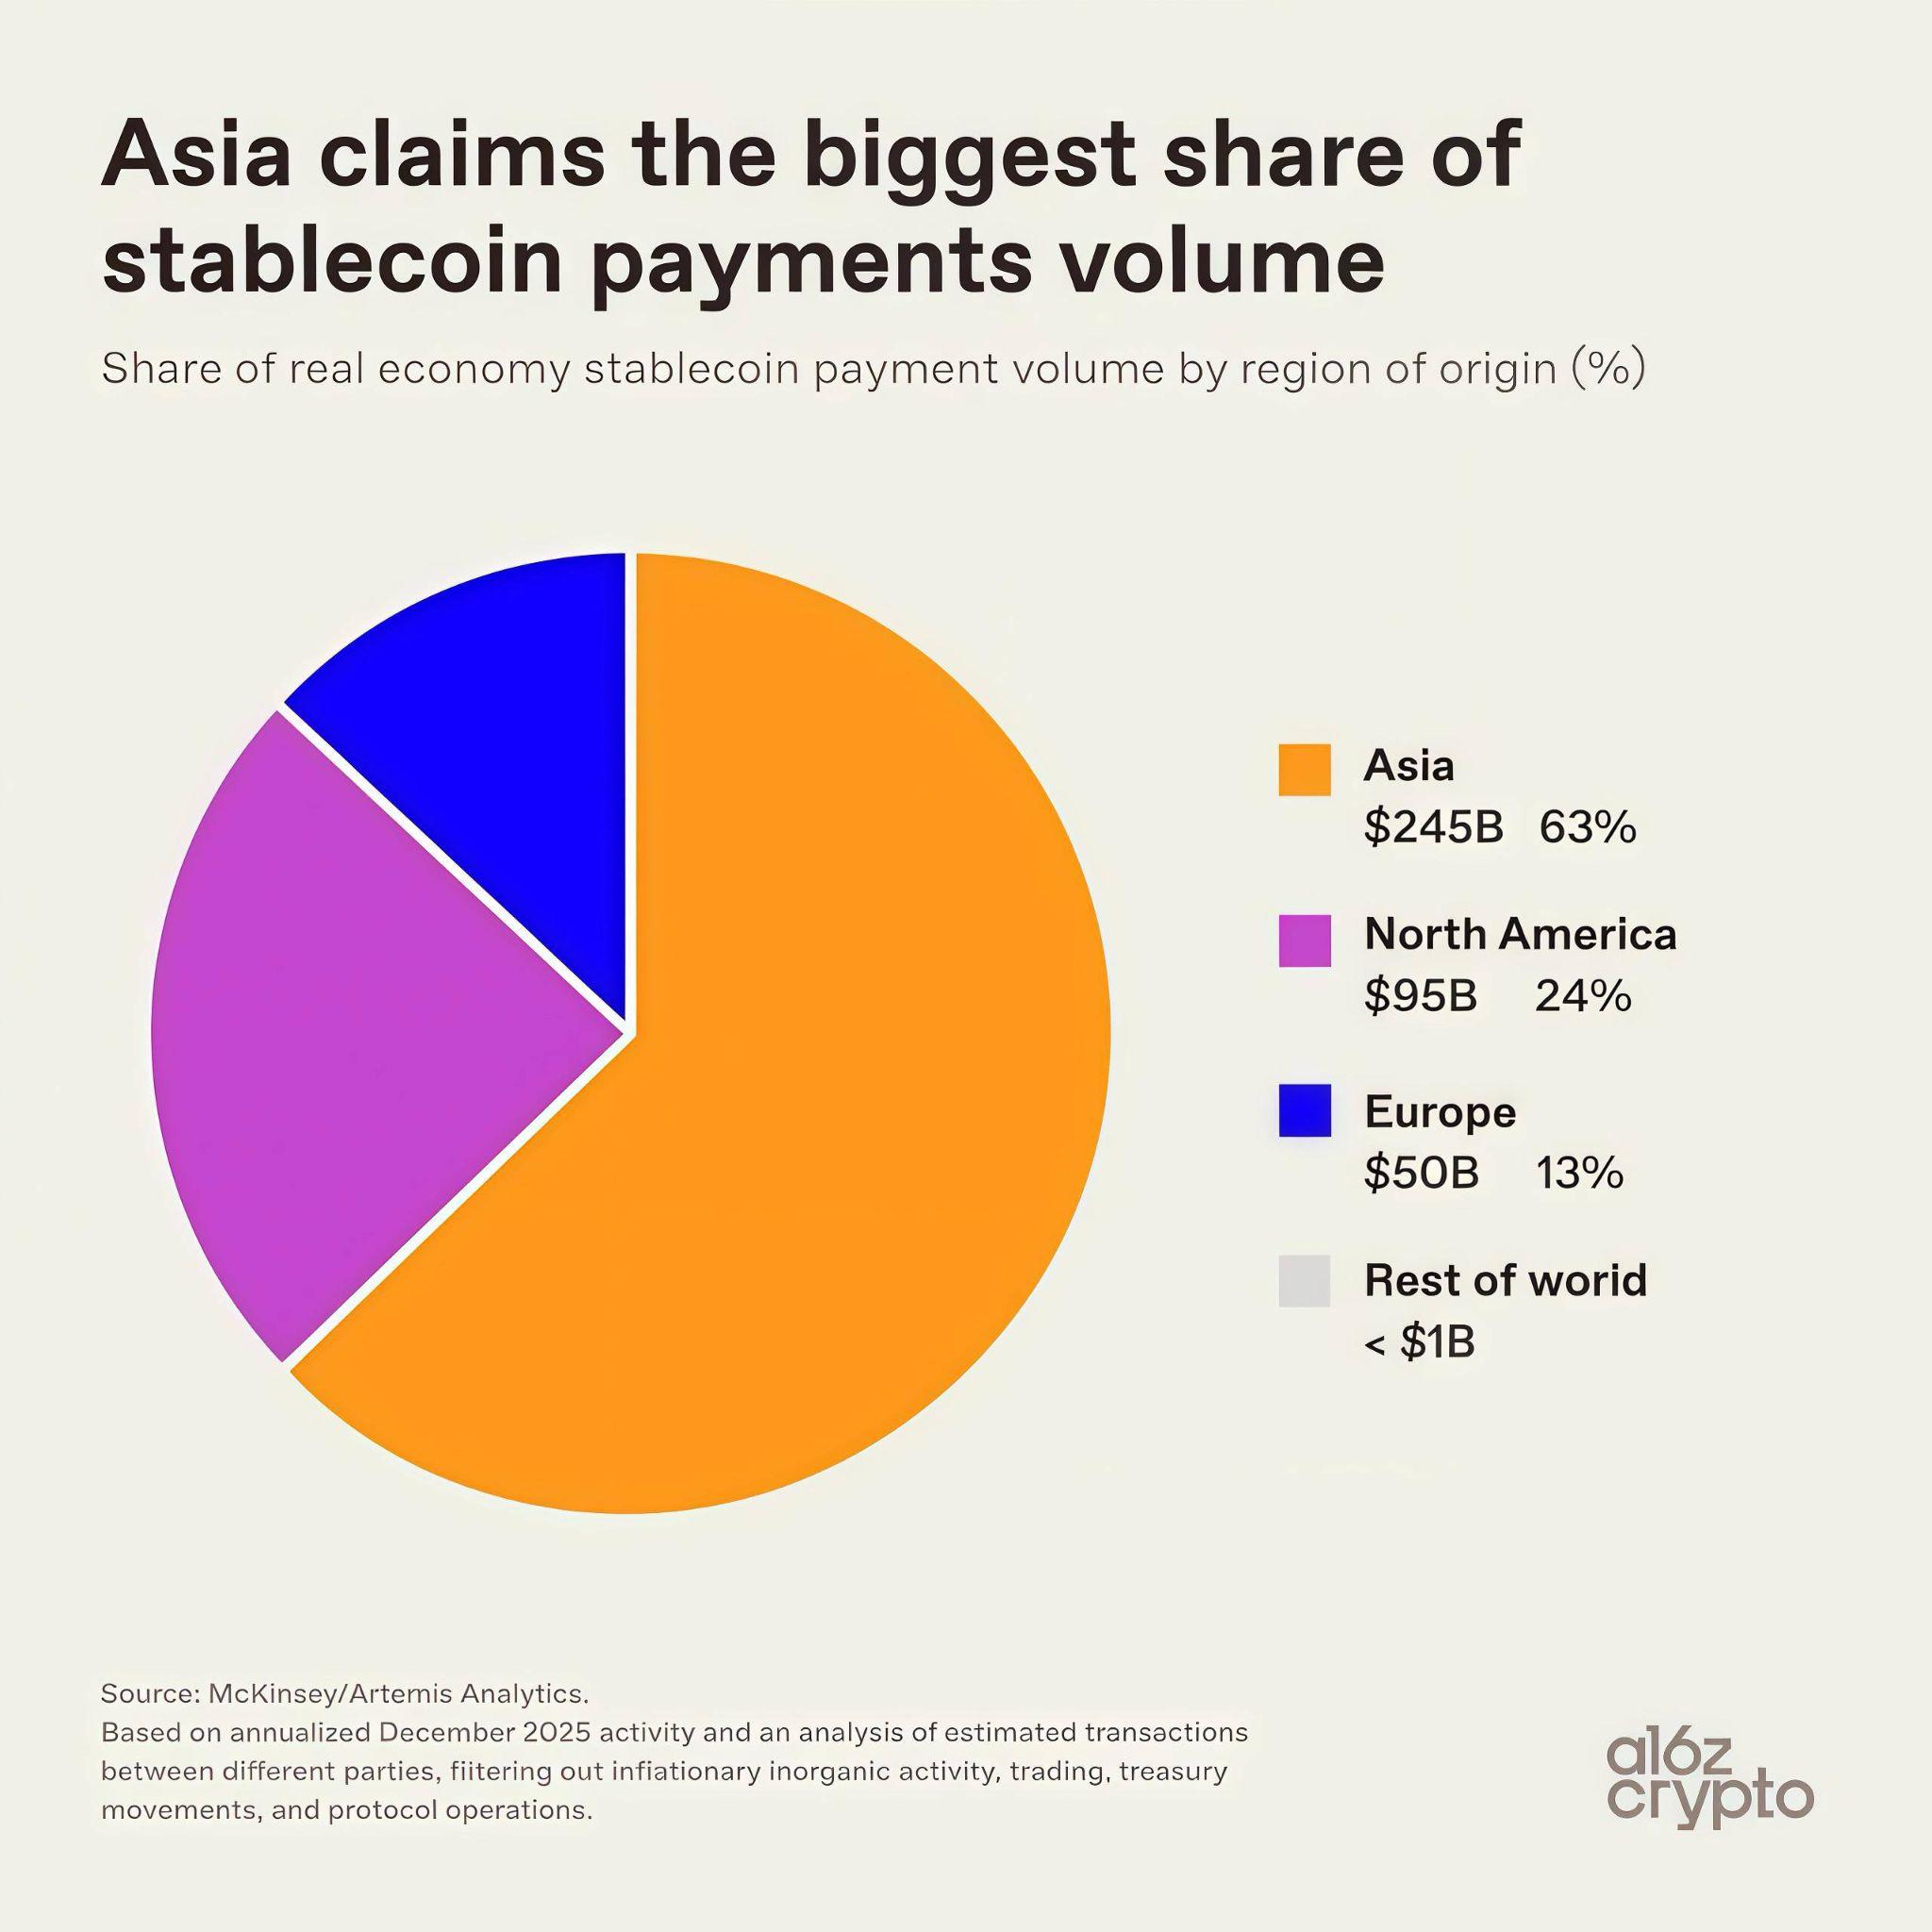
On stablecoins, Asia remains the most relevant market to watch: the region accounts for about 63% of global stablecoin payment volumes, ahead of North America and Europe. Stablecoins are moving from simple trading collateral to real payment, settlement and financial-access infrastructure.Parlando di stablecoin, l'Asia rimane il mercato più rilevante da monitorare: la regione rappresenta circa il 63% dei volumi globali di pagamento in stablecoin, davanti a Nord America ed Europa. Le stablecoin stanno passando da semplice collateral per il trading a vera infrastruttura di pagamento, settlement e accesso finanziario.
06
Key NewsNews importanti
NVIDIA beats expectations: revenue +85% to $81.6BNVIDIA batte le attese: ricavi +85% a $81.6B
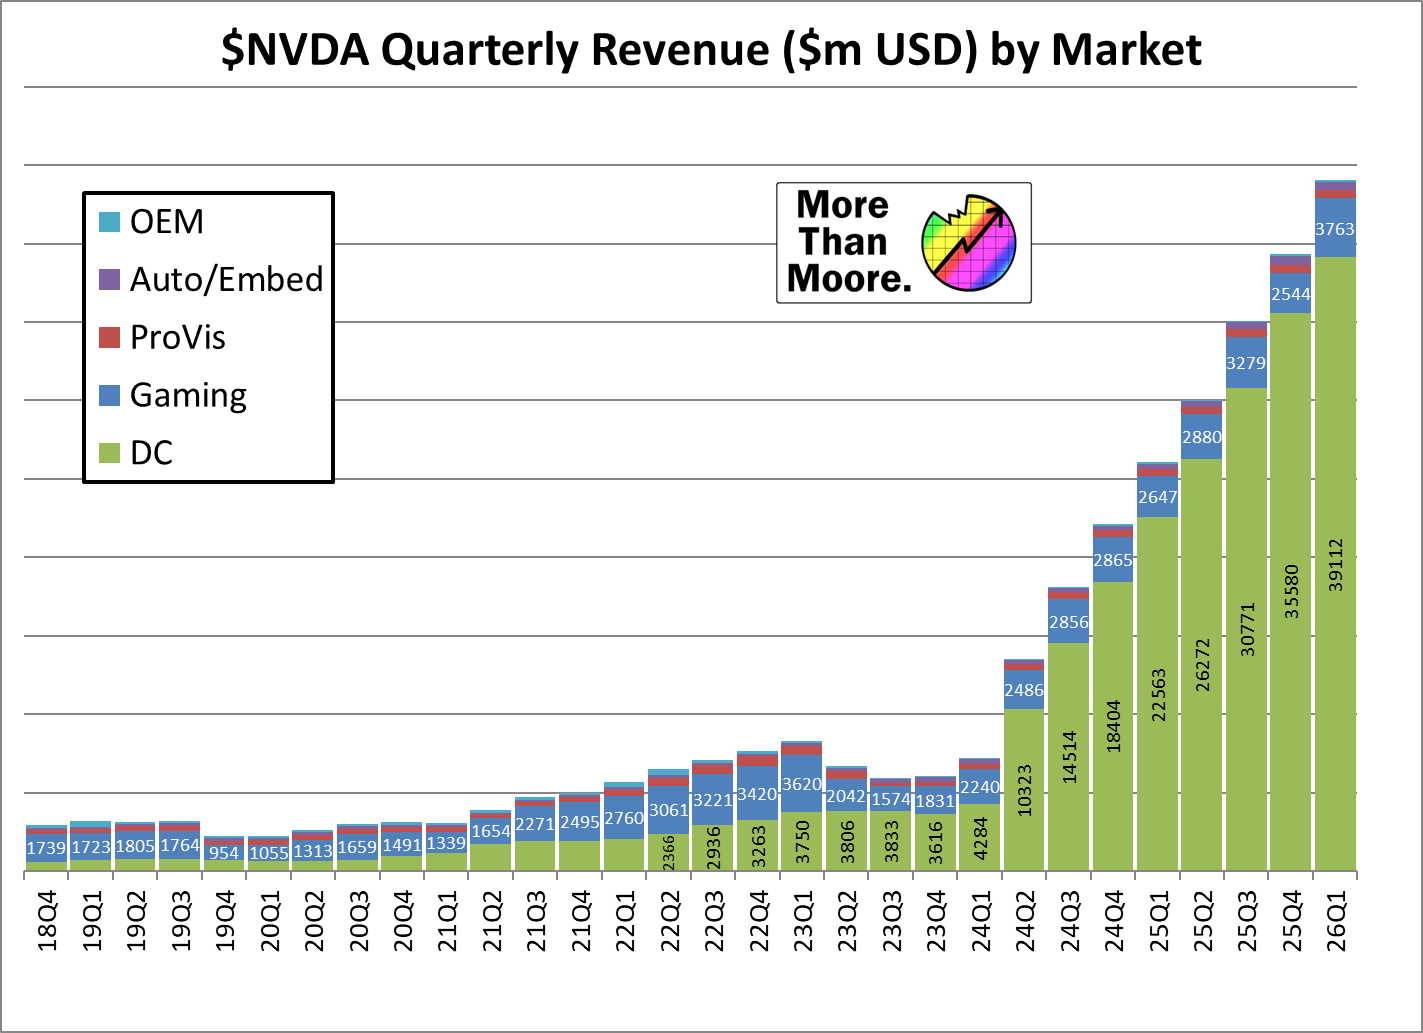
Stepping out of crypto for a moment, but on one of the market's most important themes: AI and semiconductors. This week NVIDIA reported quarterly revenue up 85%, confirming strong demand tied to AI, data centers and chips. The AI sector keeps driving a meaningful part of the S&P 500's performance, which in turn influences sentiment on risk-on assets, Bitcoin included. The message is clear: capital keeps rewarding sectors where growth, earnings and real demand are most evident.Usciamo per un momento dal mondo crypto, ma rimaniamo su uno dei temi più importanti del mercato: AI e semiconduttori. Nell'ultima settimana, NVIDIA ha riportato ricavi trimestrali in crescita dell'85%, confermando la forza della domanda legata ad AI, data center e chip. Il settore AI continua a guidare una parte rilevante della performance dell'S&P 500, che a sua volta influenza il sentiment sugli asset risk-on, incluso Bitcoin. Il messaggio è chiaro: il capitale continua a premiare i settori dove crescita, utili e domanda reale sono più evidenti.
Bank of America increases IBIT exposure, cuts ETH/SOL ETFsBank of America aumenta l'esposizione a IBIT e riduce ETH/SOL ETF
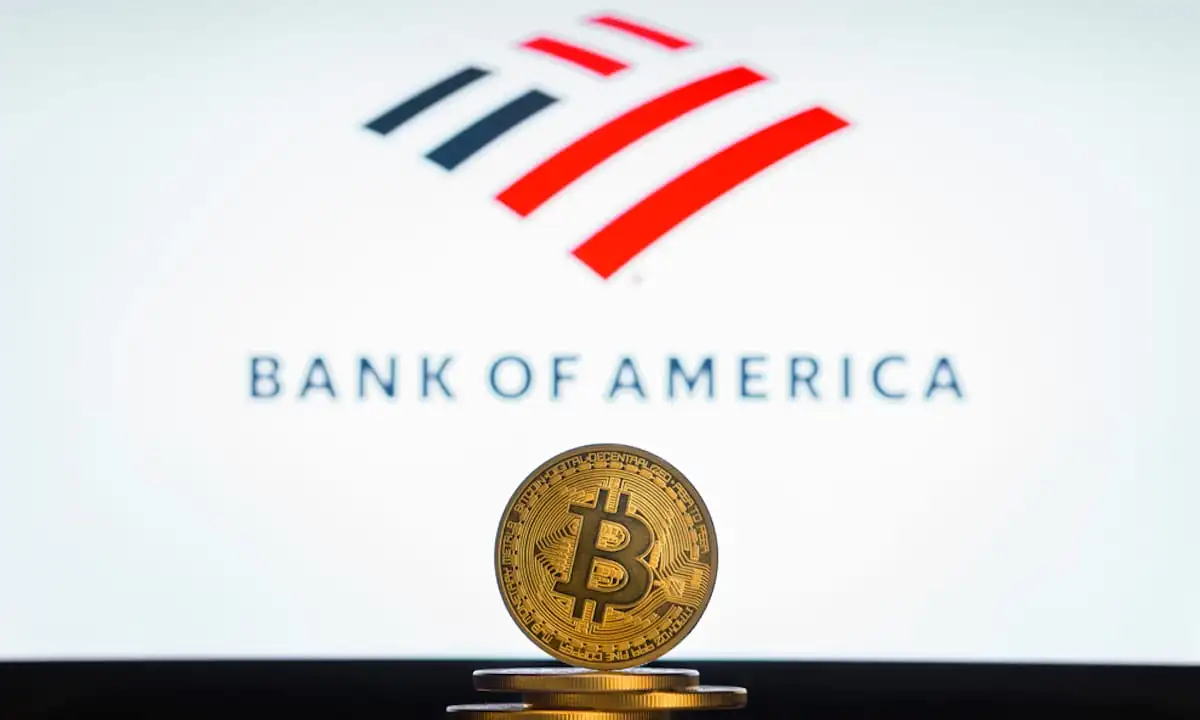
Bank of America increased its exposure to IBIT, BlackRock's spot Bitcoin ETF, strengthening institutional positioning on BTC. At the same time, it reduced exposure to Ethereum- and Solana-linked ETFs, signalling a stronger preference for Bitcoin. Institutional capital keeps favouring BTC as the primary asset, while exposure to altcoins stays more selective.Bank of America ha aumentato la propria esposizione a IBIT, l'ETF Bitcoin spot di BlackRock, rafforzando il posizionamento istituzionale su BTC. Allo stesso tempo, ha ridotto l'esposizione agli ETF legati a Ethereum e Solana, segnalando una preferenza più marcata per Bitcoin. Il capitale istituzionale continua a privilegiare BTC come asset principale, mentre l'esposizione verso le altcoin resta più selettiva.
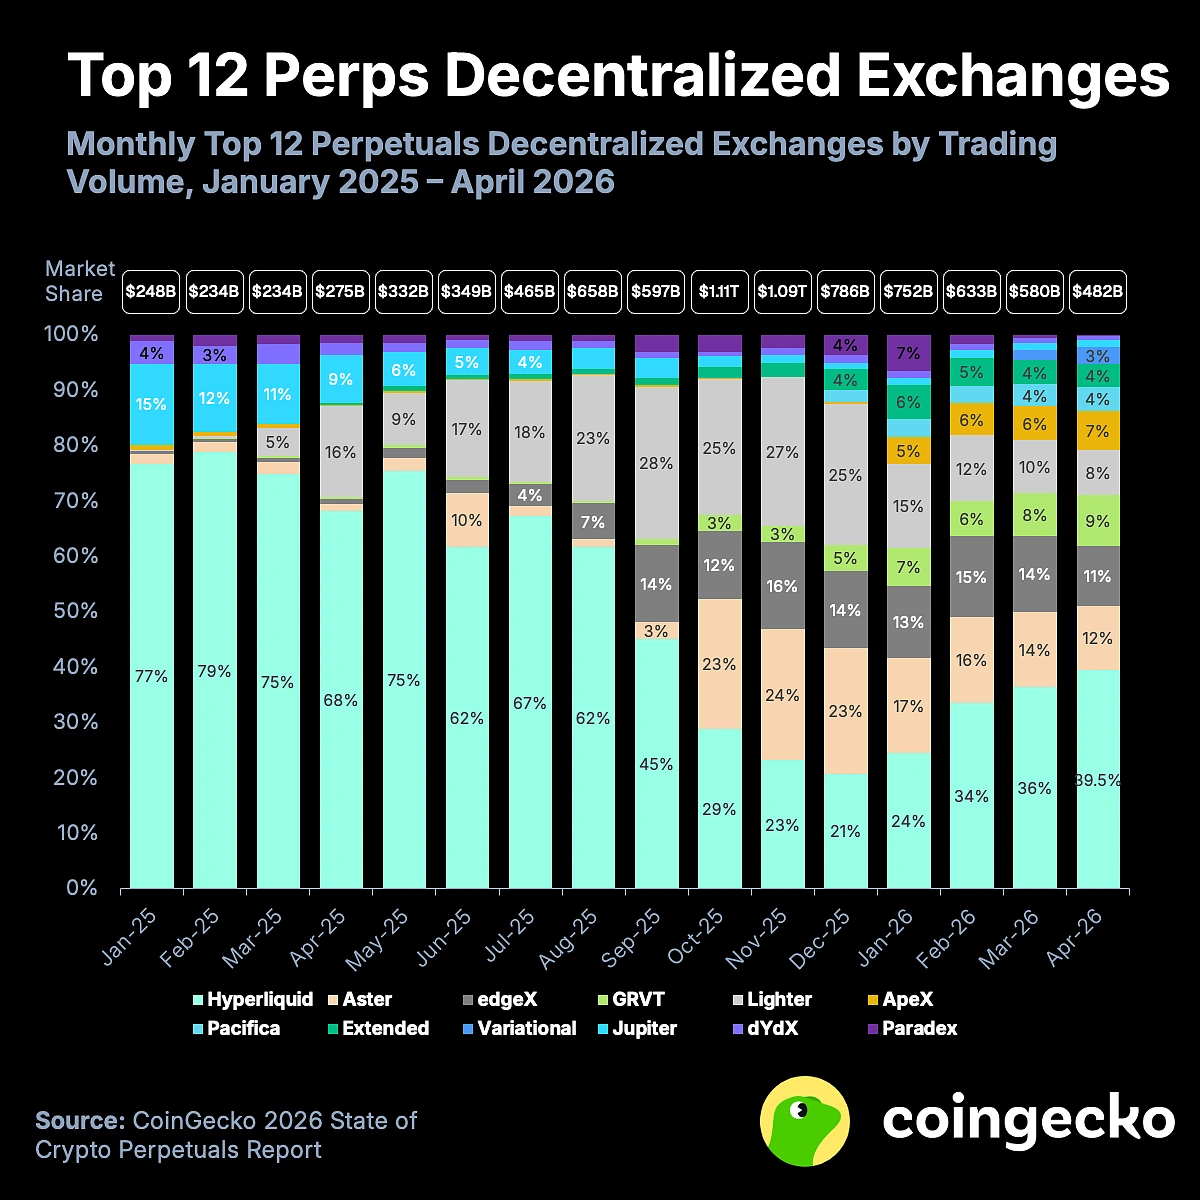
Perp DEX: liquidity keeps moving on-chainPerp DEX: la liquidità continua a spostarsi on-chain
According to CoinGecko's 2026 Crypto Perpetuals Report, Perp DEX share of total open interest rose from 3.6% at the start of 2025 to 13.5% in early 2026. It confirms the growth of on-chain perpetual trading, with an ever-larger share of liquidity shifting from CEXs to decentralized infrastructure. The trend reinforces the Perp DEX narrative, led by platforms like Hyperliquid, which keep attracting volumes, users and liquidity.Secondo il Crypto Perpetuals Report 2026 di CoinGecko, la quota dei Perp DEX sull'open interest totale è salita dal 3.6% di inizio 2025 al 13.5% nei primi mesi del 2026. Il dato conferma la crescita del trading perpetual on-chain, con una parte sempre maggiore della liquidità che si sposta dai CEX verso infrastrutture decentralizzate. Il trend rafforza la narrativa dei Perp DEX, guidata da piattaforme come Hyperliquid, che continuano ad attirare volumi, utenti e liquidità.
This report is not financial advice. The information here represents only part of a broader analysis.Questo report non è consiglio finanziario. Le informazioni qui rappresentano solo parte di un'analisi più ampia.