When asked "What drives Bitcoin's value over the long term?", there are many possible answers: the halving, adoption, ETFs, institutional investors. They are all important factors. But, in my opinion, there is one macro factor that influences many of them: liquidity.
The more money there is in the financial system, the higher the probability that assets will continue to appreciate over the long term. Personally, I believe it is very difficult to use liquidity to predict short-term price movements. Over the long run, however, I consider it one of the most important macro factors to monitor.
- What is liquidity?
- Why most assets appreciate over the long term
- How can we measure liquidity?
- M2: the fuel behind long-term markets
- The two engines of liquidity
- The Federal Reserve
- Commercial banks
- Using liquidity indicators in practice
- Conclusion
1. What Is Liquidity?
Liquidity is simply the amount of money available within the financial system. The more money circulating in the economy, the more capital is available to invest.
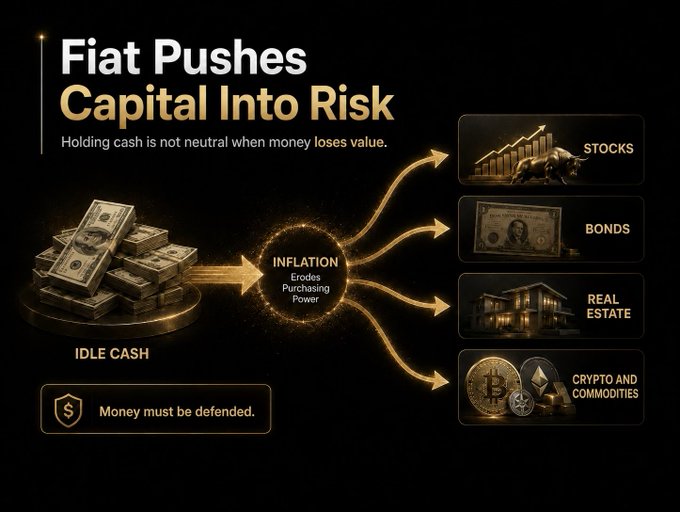
That capital can flow into real estate, stocks, gold, Bitcoin - and virtually any other asset. The greater the available liquidity, the higher the probability that asset prices will continue to rise.
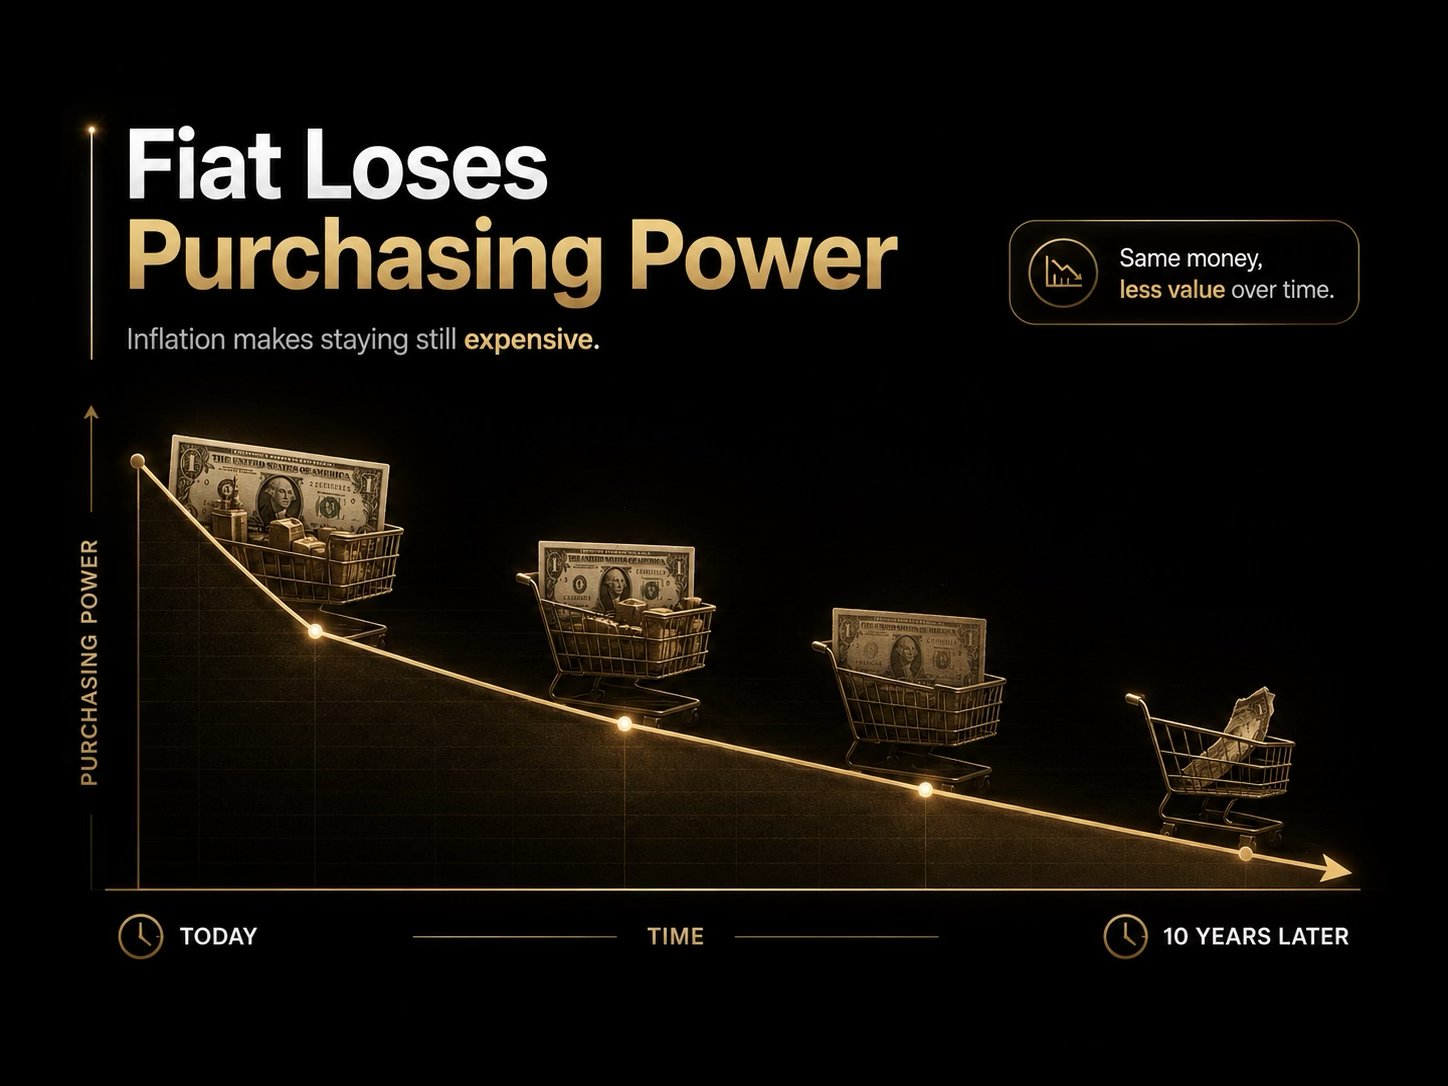
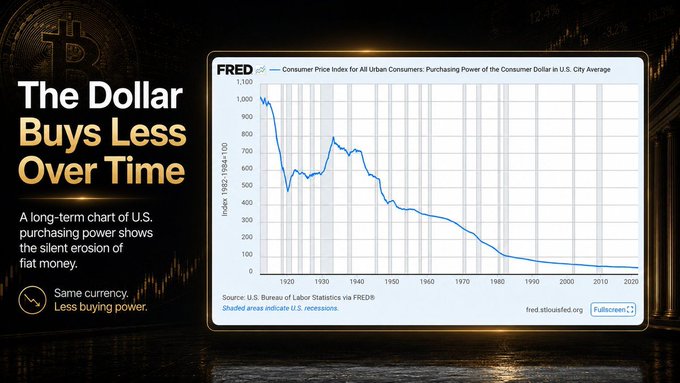
The same principle applies to goods and services: when more money circulates throughout the economy, their prices also tend to increase. This is the phenomenon we know as inflation.
2. Why Do Most Assets Appreciate Over the Long Term?
If we look at the long-term charts of major asset classes, we notice one common characteristic: almost all of them are in long-term uptrends. Here are a few examples.
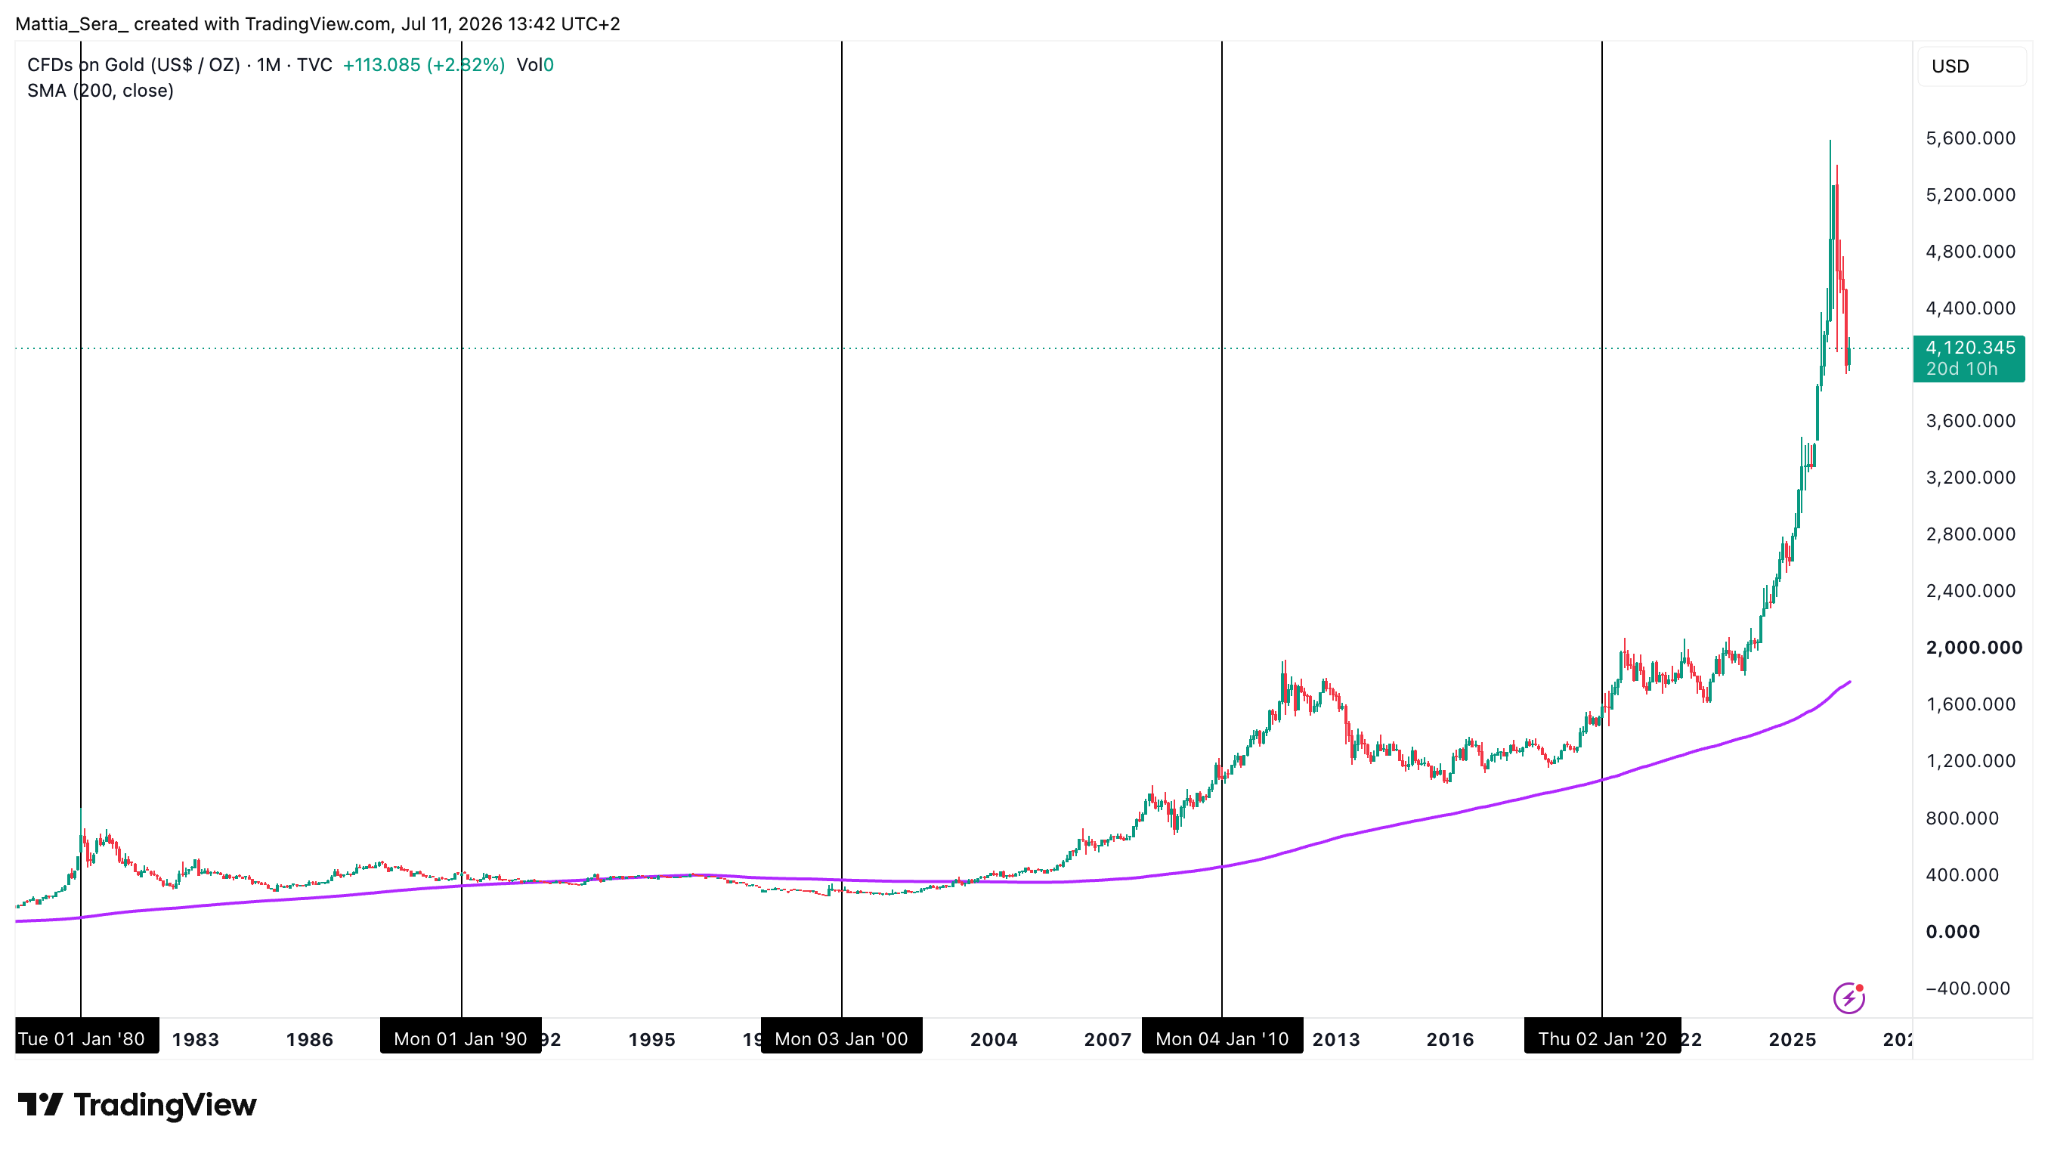
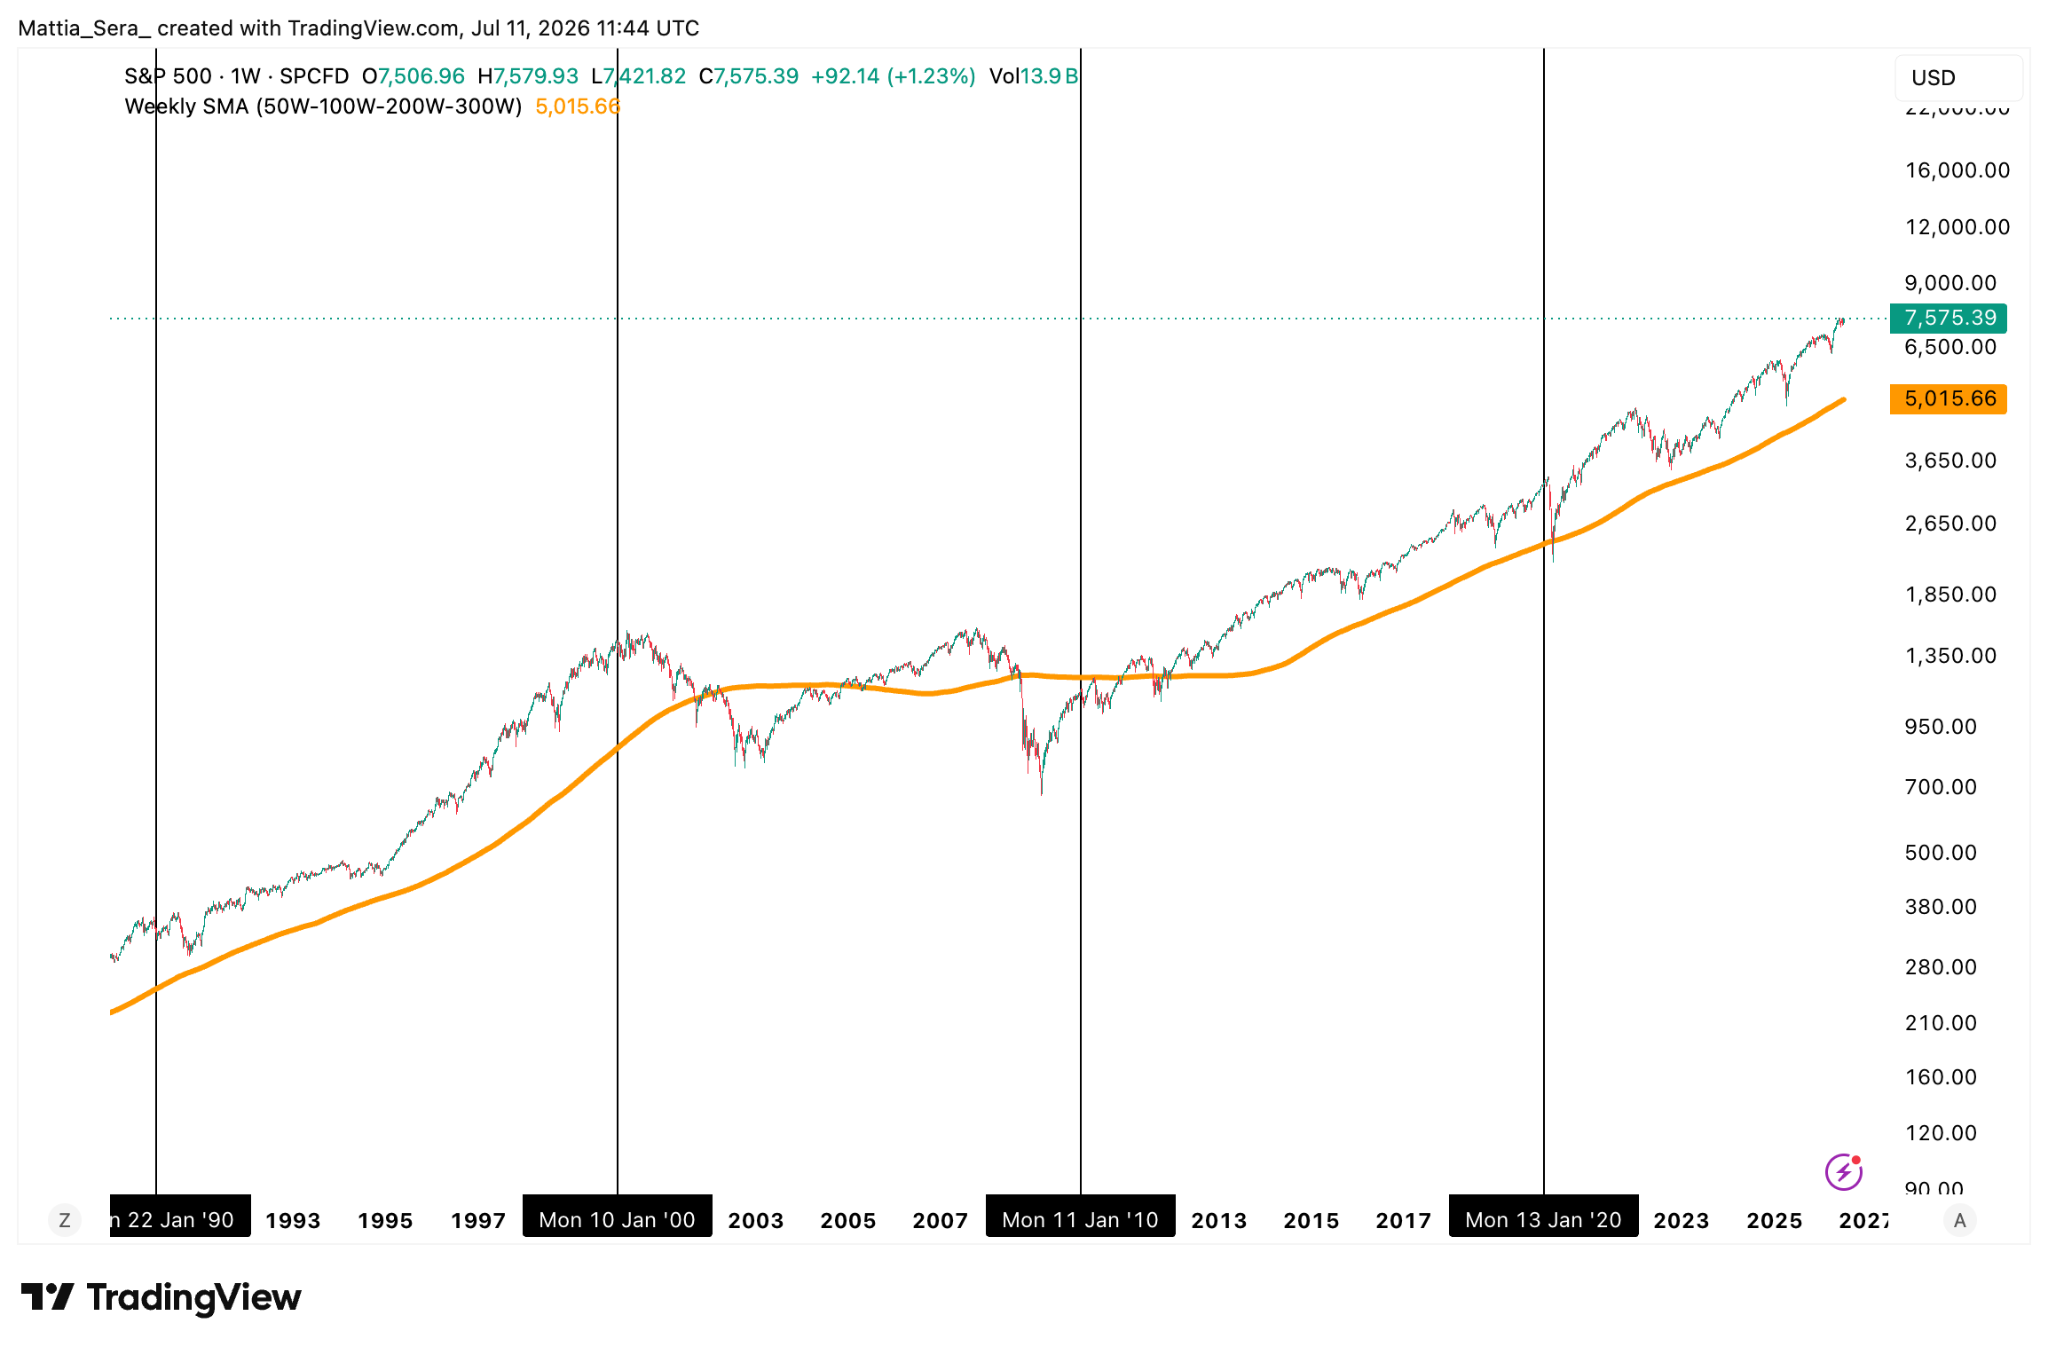
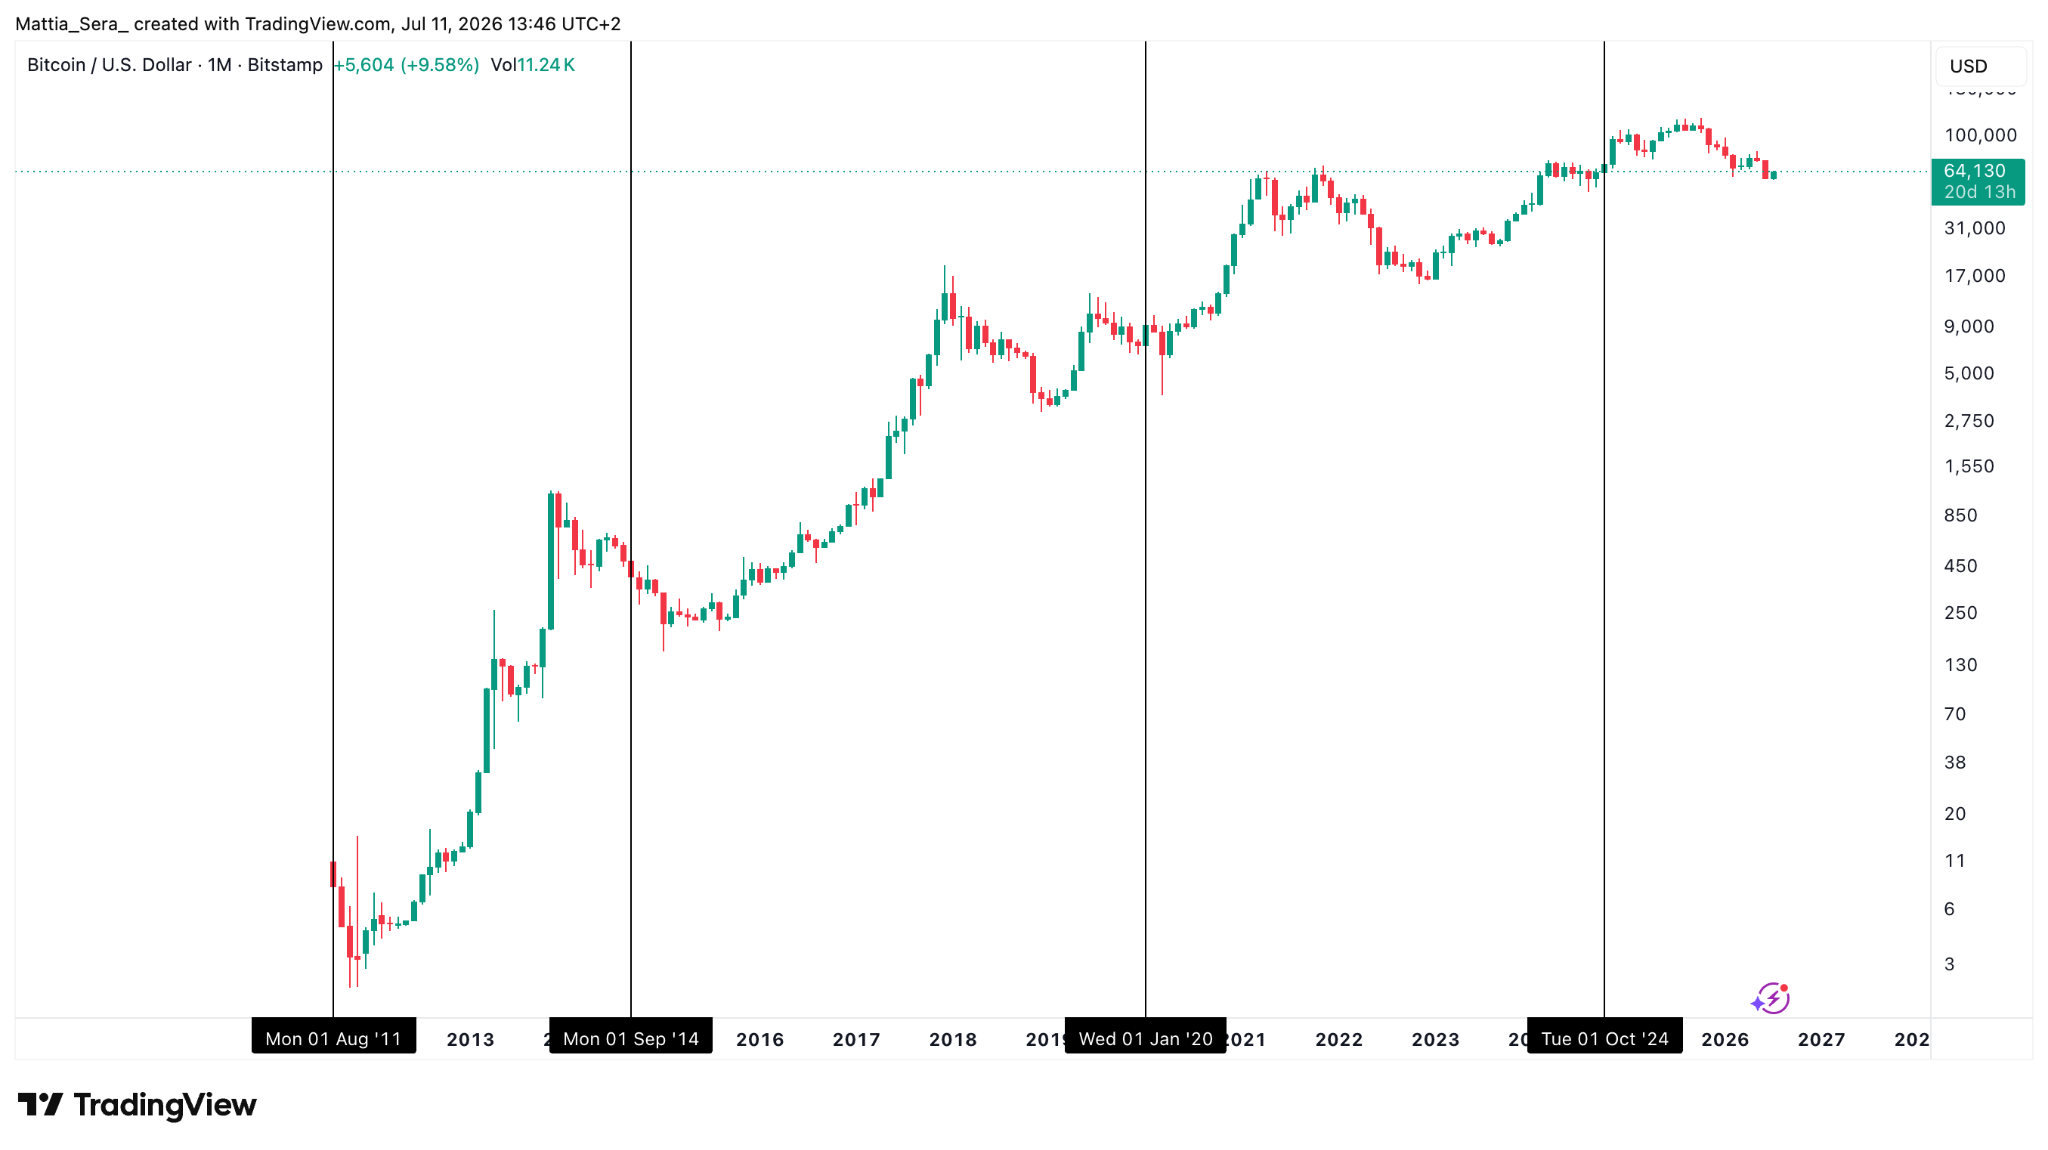
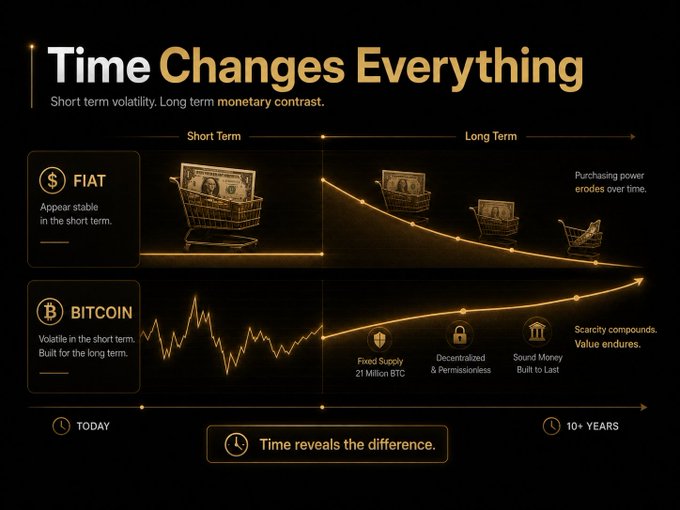
This is not a coincidence. Over time, the amount of money in the financial system continues to grow, and sooner or later that money gets invested. That is one of the main reasons why, over sufficiently long time horizons, most assets tend to increase in value.
Of course, there will be corrections - some of them very severe. But the long-term trend is influenced by one very simple factor: liquidity.
3. How Can We Measure Liquidity?
Understanding that liquidity matters is relatively straightforward. Measuring how much liquidity exists in the system today is fairly straightforward as well. Predicting how much liquidity could enter markets over the coming months, however, is much more difficult.
To measure liquidity, economists use several monetary aggregates:
- M0
- M1
- M2
- M3
The lower the number, the more immediately available the money is; the higher the number, the broader the definition, including less liquid forms of money. In other words, M0 is the most liquid form of money, while M3 also includes less liquid instruments. For this article, we'll focus on M2 - the aggregate most commonly used to measure liquidity in the economy, which historically has shown a meaningful relationship with risk assets.
4. M2: The Fuel Behind Long-Term Markets
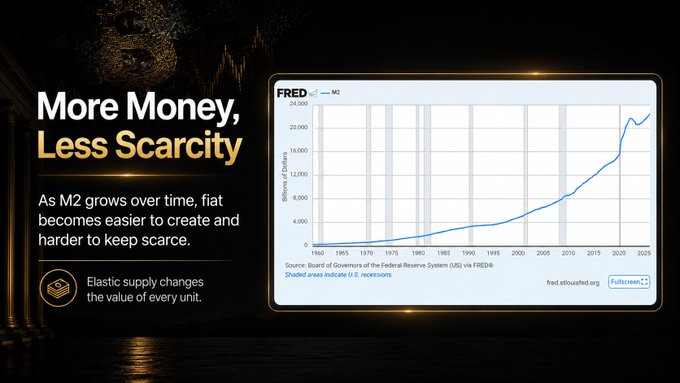
M2 includes physical cash in circulation, demand deposits (checking accounts), savings deposits, small time deposits and retail money market funds.
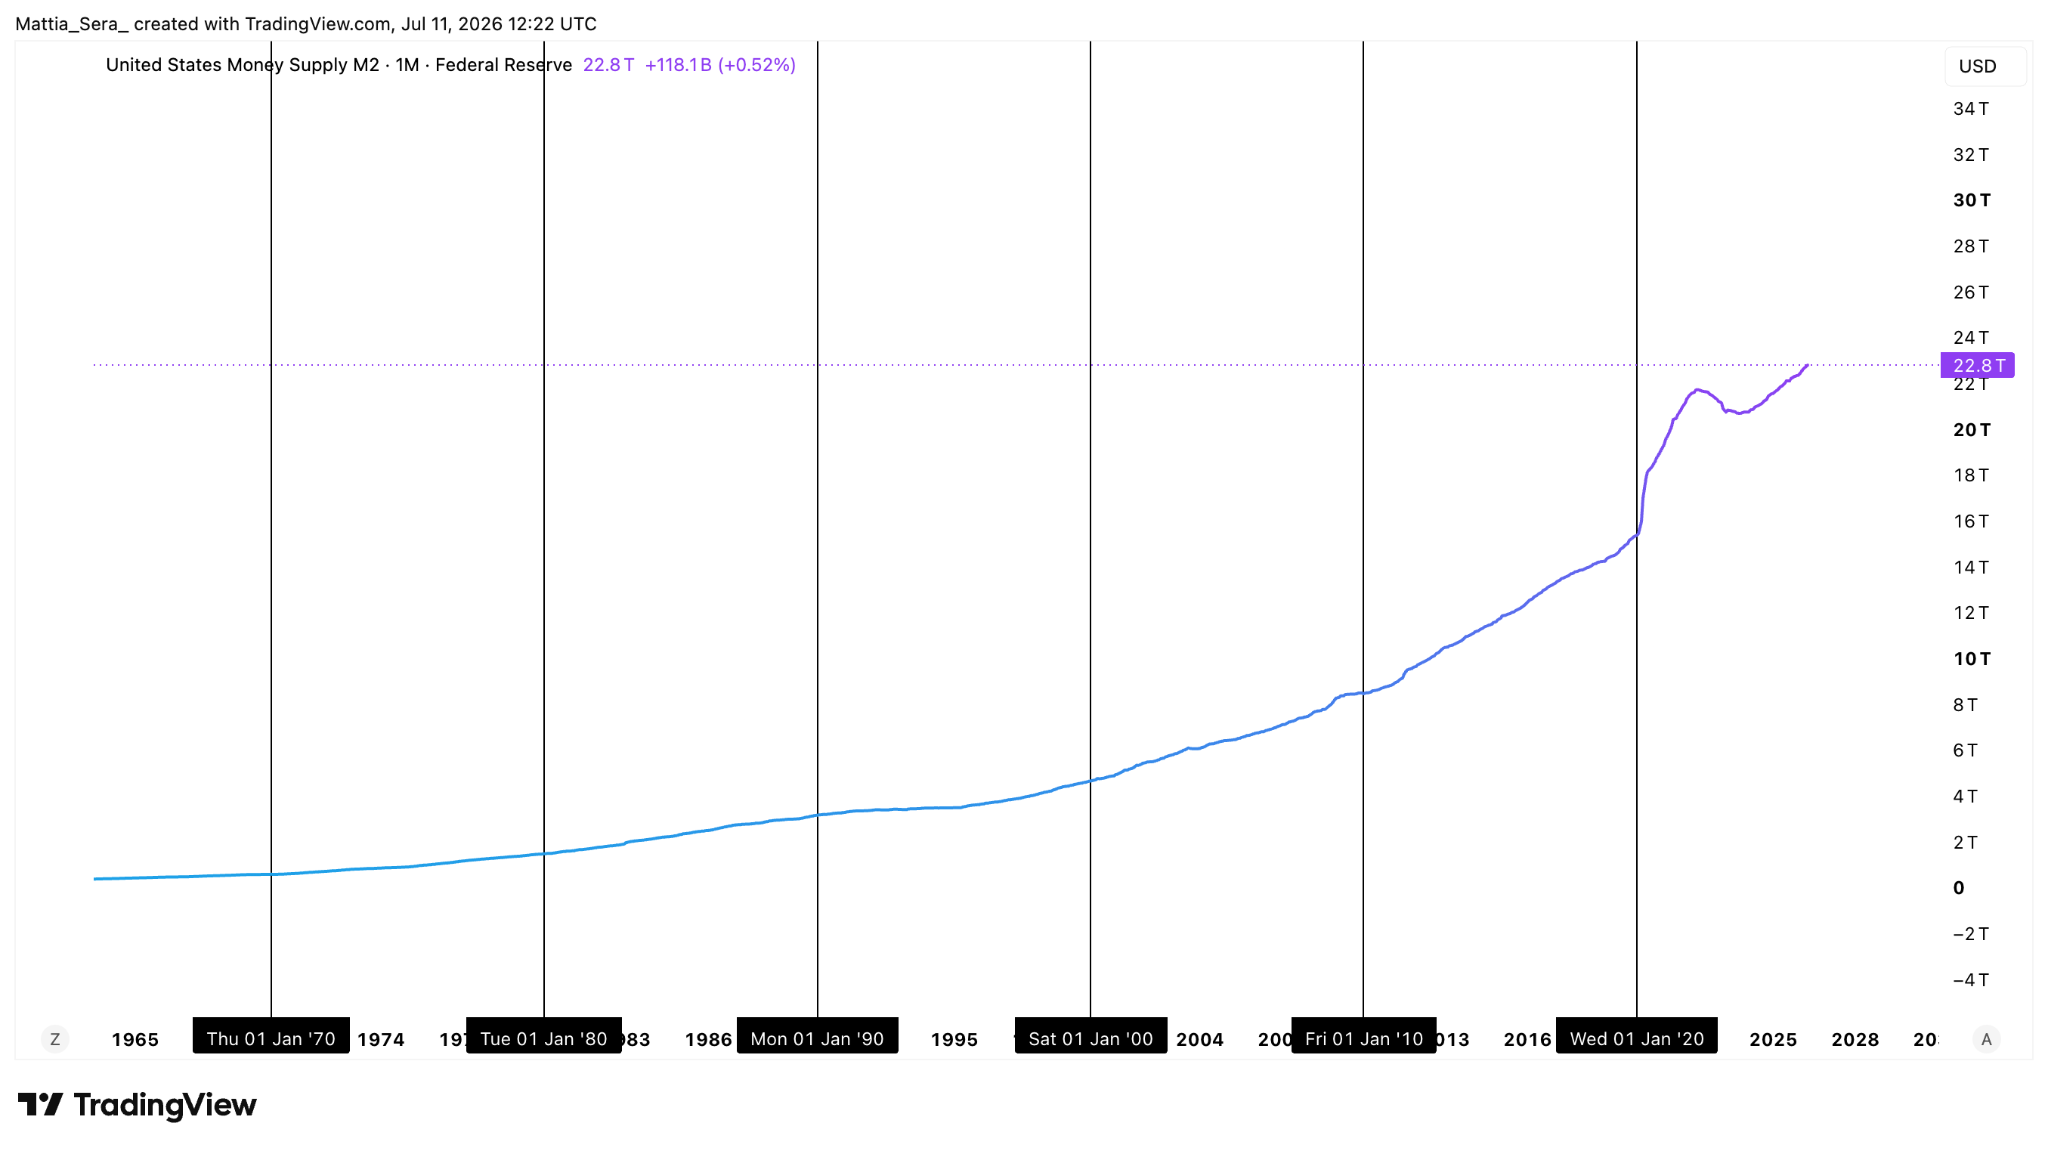
Liquidity has continued to expand over time. This is one of the fundamental reasons why, over the long term, asset prices tend to rise - the same reason goods and services become more expensive: inflation.
5. The Two Engines of Liquidity
If liquidity is so important, what causes it to expand or contract? There are two primary engines. The first is the Federal Reserve, the central bank of the United States. The second is commercial banks.
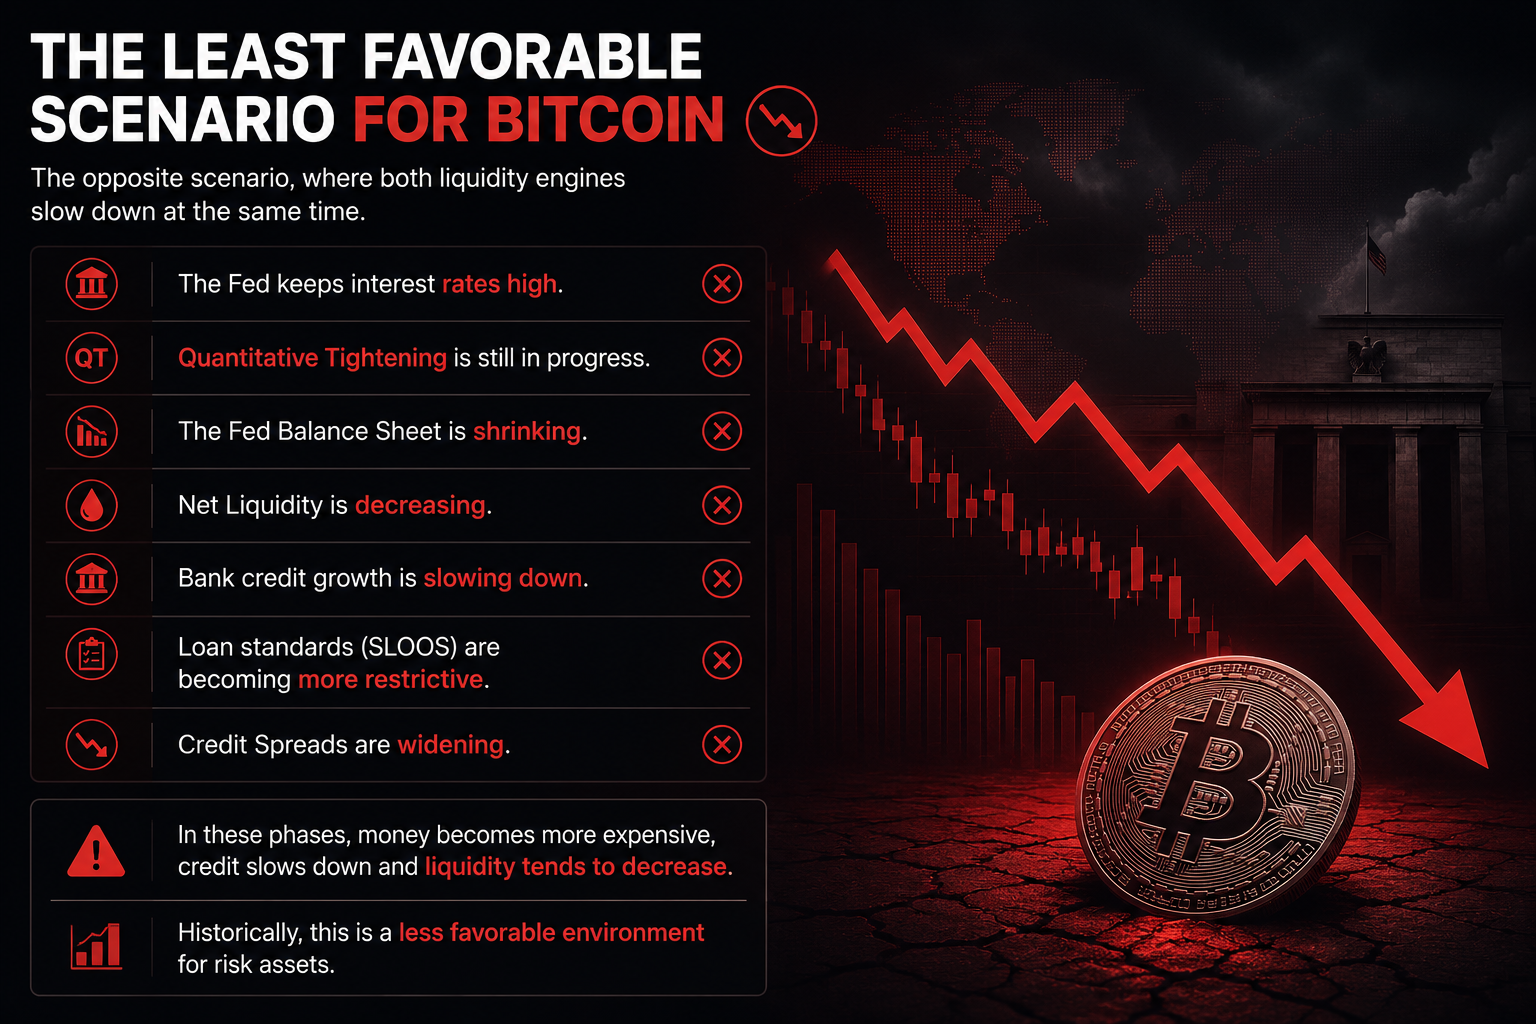
The Fed influences liquidity through monetary policy; commercial banks through credit creation. When both move in the same direction, liquidity can expand rapidly. When both slow down simultaneously, liquidity tends to contract.
6. The Federal Reserve
The Federal Reserve primarily influences liquidity through four main tools:
- Fed Funds Rate
- Fed Balance Sheet (WALCL)
- Net Liquidity
- FOMC Meetings & Dot Plot
1) Fed Funds Rate
The Fed Funds Rate is the benchmark interest rate set by the Federal Reserve - probably the most closely watched macro indicator in markets. When rates are lowered, borrowing becomes cheaper and households and businesses tend to spend and invest more; when rates are raised, borrowing becomes more expensive and activity tends to slow. But there is an even more important point: markets don't wait for the Fed to move - they try to anticipate it. For that reason, expectations about future rates are often more important than the decision itself.
2) Fed Balance Sheet (WALCL)
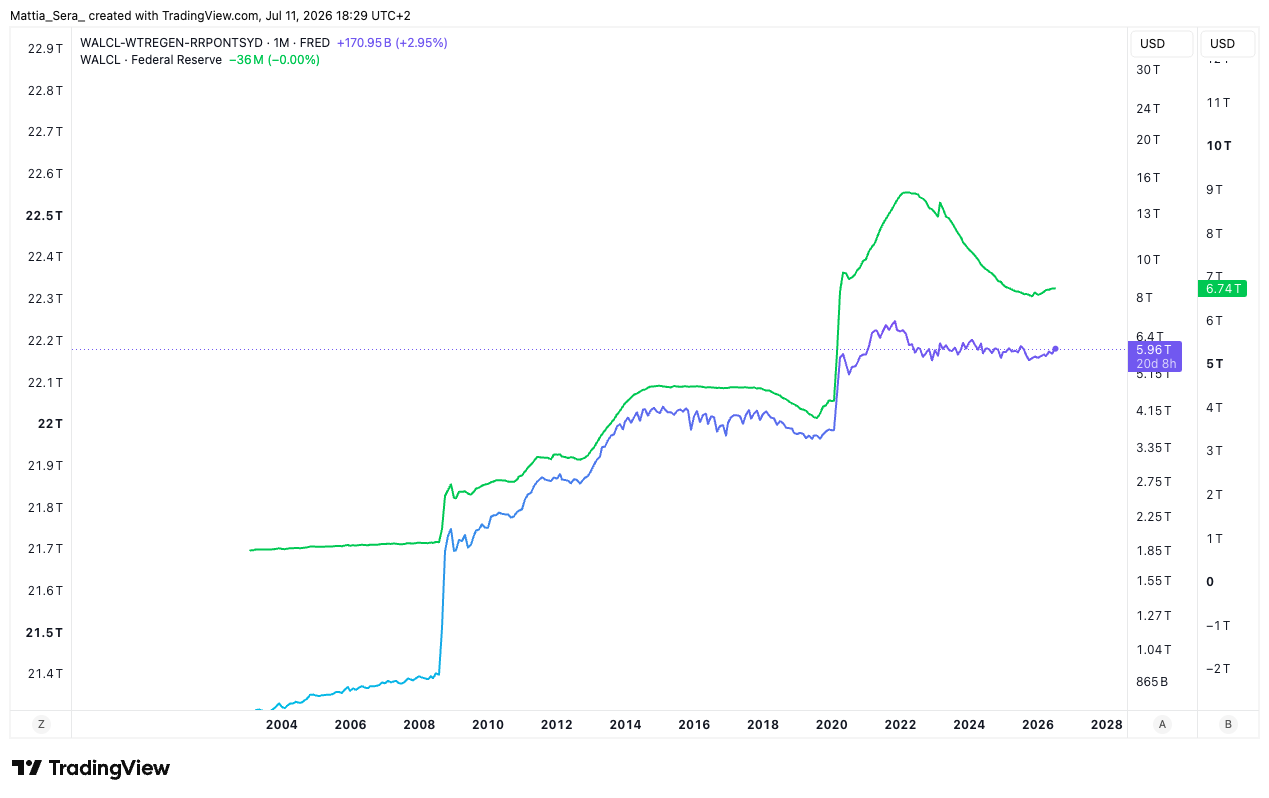
The second indicator is the Fed's Balance Sheet (WALCL), the total value of the assets held by the Federal Reserve. When it expands, the Fed is buying assets and injecting liquidity - Quantitative Easing (QE). When it contracts, the Fed is withdrawing liquidity - Quantitative Tightening (QT). It is one of the most direct indicators of whether the central bank is expanding or tightening liquidity.
3) Net Liquidity
The Balance Sheet, however, doesn't tell the whole story. To estimate how much liquidity is actually available to markets, investors often monitor Net Liquidity:
The Treasury General Account (TGA) is the government's account at the Fed: when its balance rises, part of the liquidity is temporarily parked instead of circulating. The Reverse Repo Facility (RRP) lets money market funds and institutions deposit excess cash at the Fed for a short-term return - also temporarily removing that liquidity from markets. So Net Liquidity is a more realistic estimate: the Balance Sheet is "gross" liquidity, Net Liquidity is the liquidity actually available to markets.
4) FOMC Meetings & Dot Plot
Besides charts, there are events that can significantly influence liquidity - the most important being the FOMC meetings. After each meeting the Fed publishes the rate decision, the official statement, updated economic projections, and the Dot Plot (where members expect rates to be in the future). These help investors understand how the Fed sees the economy and its next moves. They can be accessed through the official Federal Reserve calendar: federalreserve.gov.
7. Commercial Banks
The Fed is not the only engine of liquidity - commercial banks play a fundamental role. Every time a bank issues a new loan, a new deposit is created; in other words, new M2 is created. When lending expands, liquidity increases; when lending slows, M2 growth also slows. To understand what banks are doing, we can monitor several indicators.
1) Fed Funds Rate
Interest rates are just as important for commercial banks. When borrowing costs decline, demand for loans tends to increase and banks become more willing to lend - so liquidity expands.
2) TOTBKCR
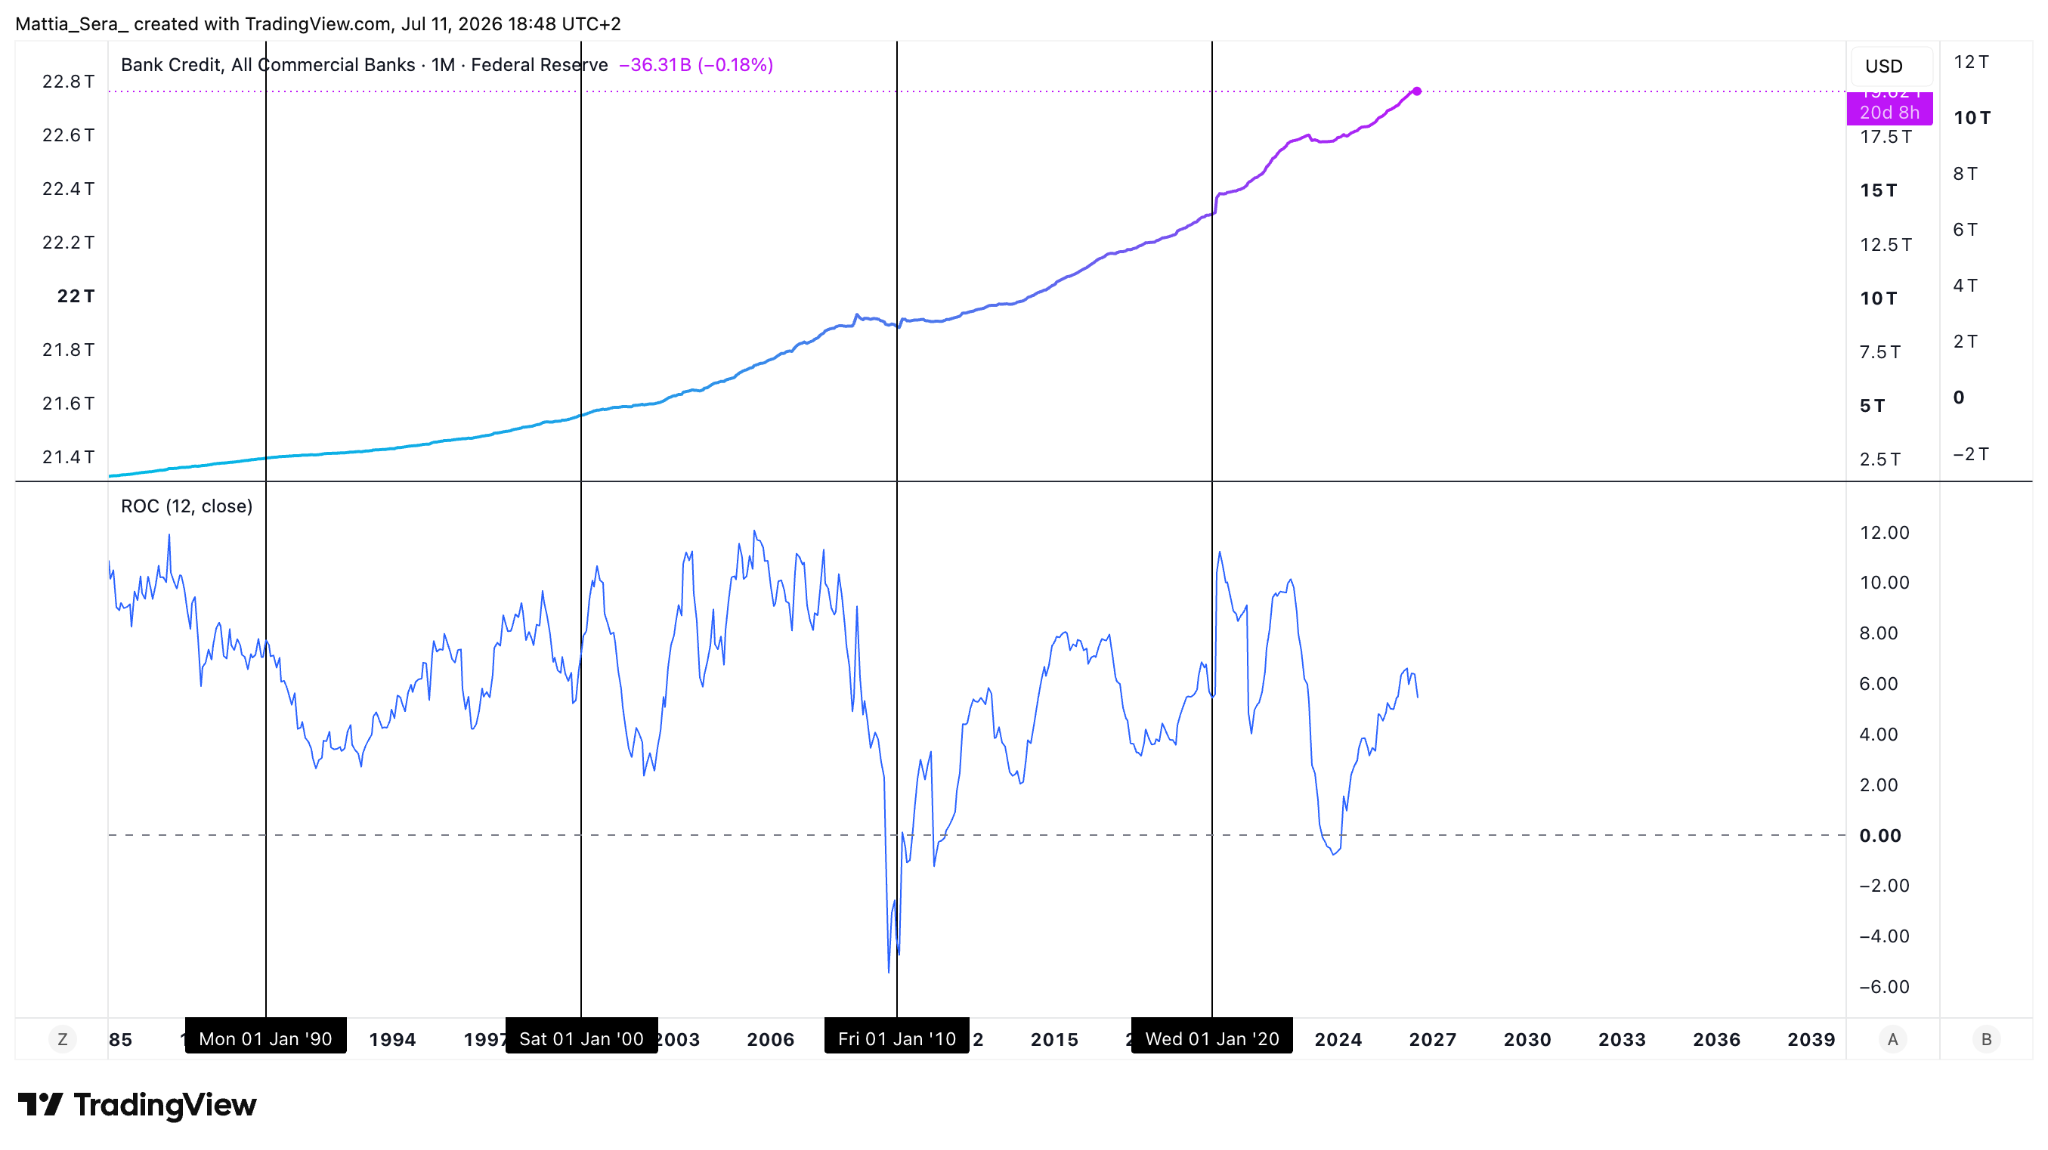
TOTBKCR measures the total credit extended by commercial banks - one of the most direct indicators of whether lending is expanding or slowing. If it rises, banks are creating new liquidity; if it slows or declines, credit creation is losing momentum. Below it is shown with the Rate of Change (ROC) to measure its year-over-year growth.
3) Senior Loan Officer Survey (SLOOS)
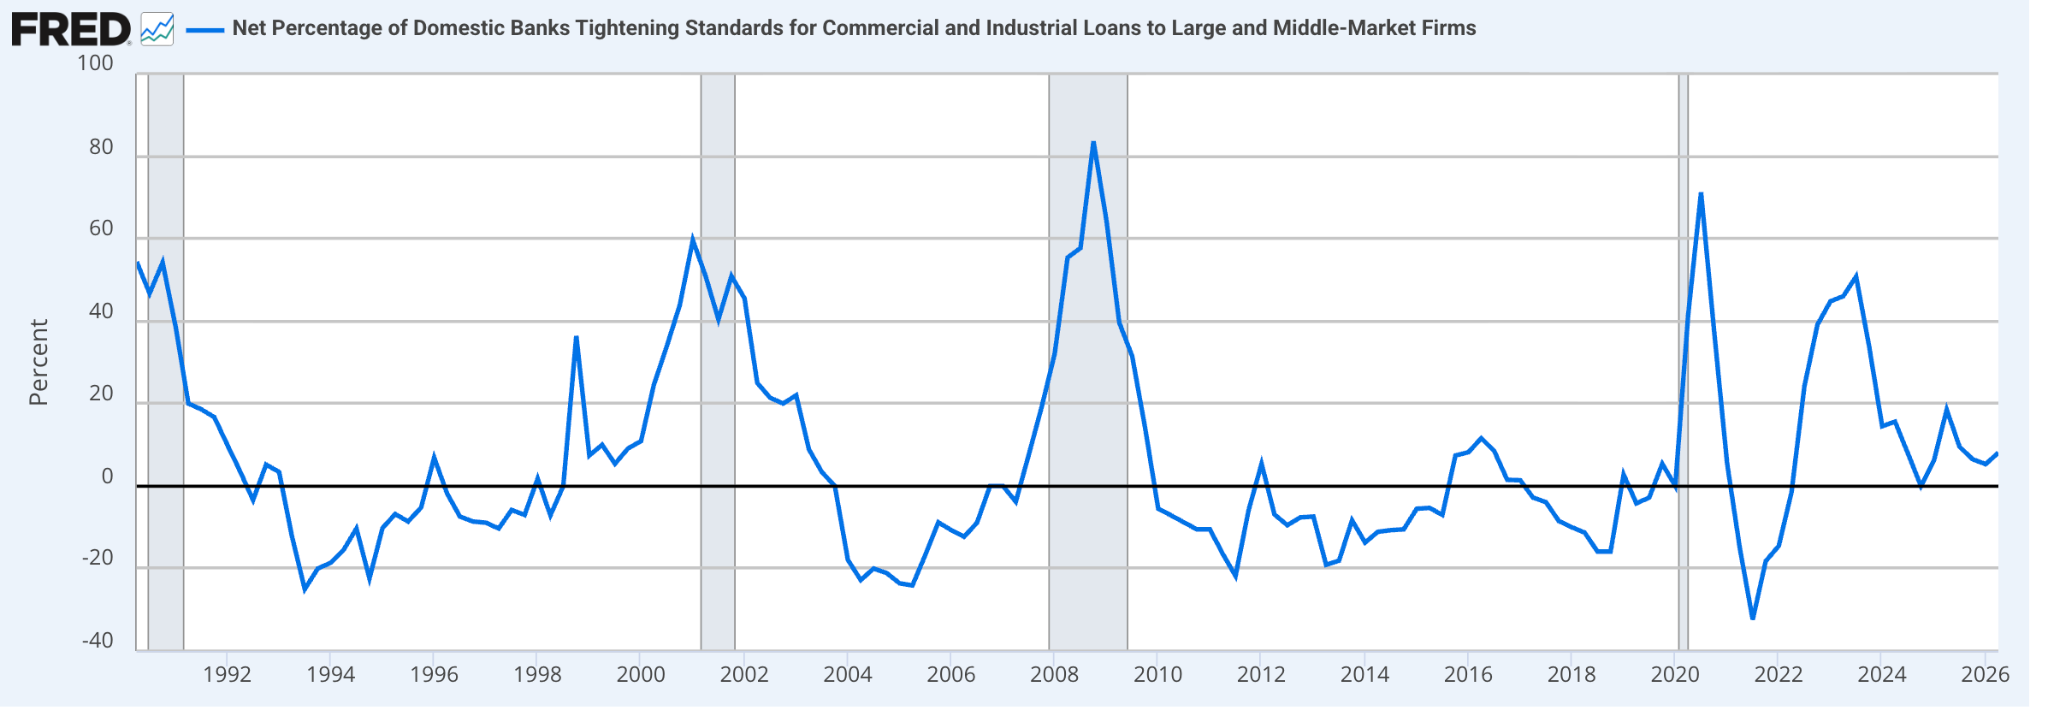
The SLOOS is a quarterly survey by the Federal Reserve: banks report whether they are making it easier or harder for households and businesses to obtain loans. If standards are easing, credit growth and liquidity often improve in the following months; if they tighten, credit creation and M2 growth tend to slow. It hasn't shown a high correlation with BTC in the past, but it's a useful gauge of the credit cycle.
4) Credit Spreads
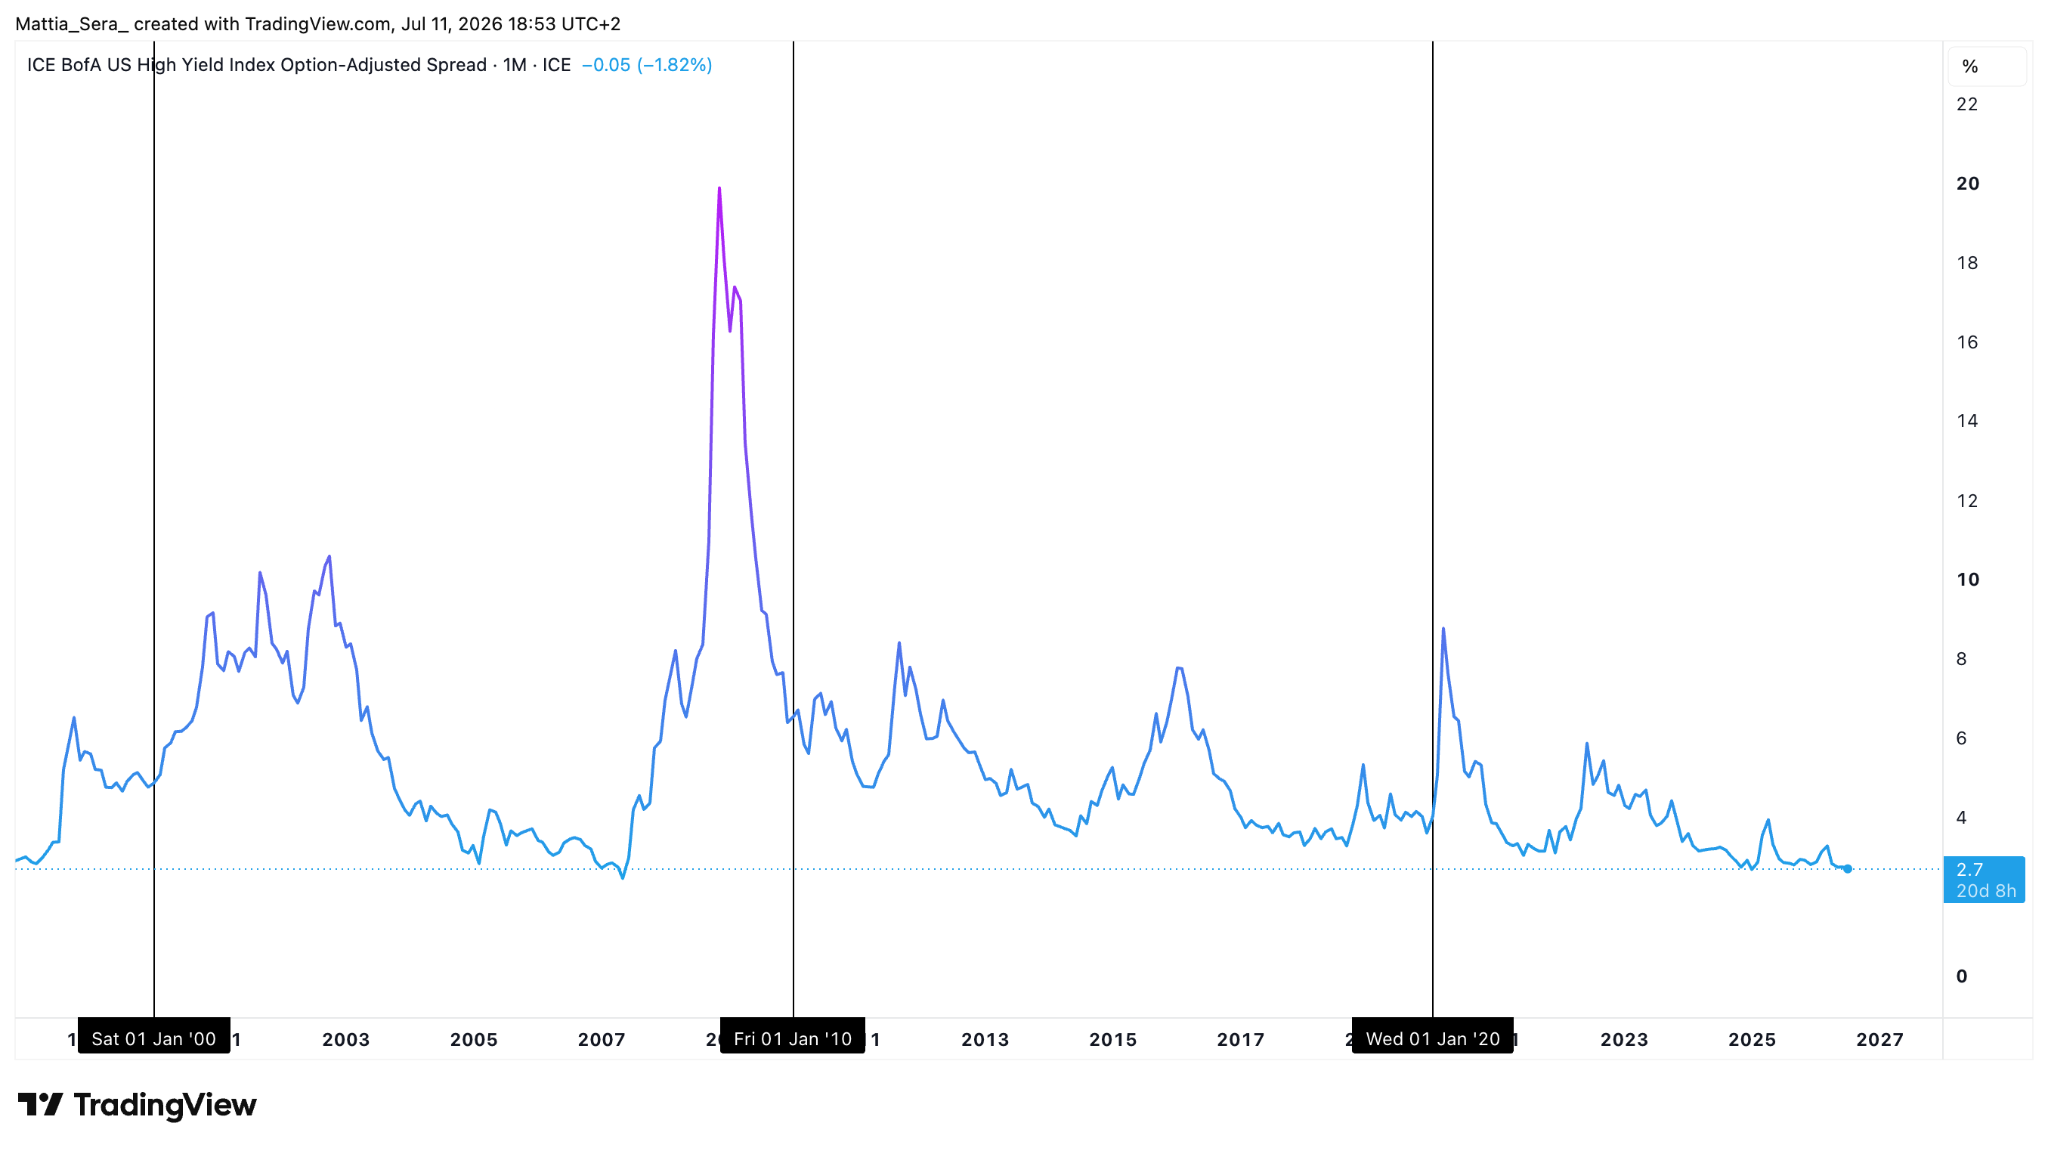
Credit Spreads measure the yield difference between riskier corporate bonds and safer government bonds. When spreads narrow, investors are more willing to take risk and credit flows more easily; when they widen, financial stress rises and credit conditions deteriorate. They are an excellent barometer of overall liquidity conditions.
8. How to Use Liquidity Indicators in Practice
Personally, I believe it is extremely difficult to gain an edge by using liquidity alone to predict Bitcoin's short-term movements (less than three months) - over shorter horizons many other factors drive price. I don't use liquidity to forecast the next few weeks. However, I believe it is essential to understand where we are in the liquidity cycle.
Liquidity is one of the main macro forces influencing Bitcoin and all risk assets. At the same time, history shows bull markets have not necessarily started the moment the Fed cut rates or launched QE - in many cases Bitcoin actually anticipated those shifts. Even so, it's essential to be aware of the current monetary environment. The goal is to understand whether the macro backdrop is becoming more - or less - supportive for risk assets.

9. Conclusion
Liquidity alone is not enough to predict Bitcoin's price movements. In the short term, price can be influenced by dozens of factors: sentiment, macro events, news, investor positioning and much more. Over the long term, however, understanding the direction of liquidity is one of the most valuable tools an investor can have. For that reason, I constantly monitor these indicators.
Furthermore, Bitcoin is becoming an increasingly institutional asset and, as a result, increasingly influenced by macro factors. Today no single liquidity indicator has shown a perfect correlation with Bitcoin in every cycle. But I believe liquidity will become an increasingly important driver over the coming years - which is precisely why I keep monitoring the tools discussed in this article.
Alla domanda "Cosa fa aumentare il valore di Bitcoin nel lungo periodo?" esistono molte risposte: l'halving, l'adozione, gli ETF, gli investitori istituzionali. Sono tutti fattori importanti. Ma, secondo me, esiste un fattore macro che influenza gran parte di questi elementi: la liquidità.
Maggiore è la quantità di denaro presente nel sistema, maggiore è la probabilità che gli asset continuino ad aumentare di valore nel lungo periodo. Personalmente credo sia molto difficile usare la liquidità per prevedere i movimenti di breve periodo. Sul lungo periodo, invece, penso sia uno dei fattori macro più importanti da monitorare.
- Cos'è la liquidità?
- Perché quasi tutti gli asset salgono nel lungo periodo
- Come misurare la liquidità
- La M2: il carburante dei mercati
- I due motori della liquidità
- La Federal Reserve
- Le banche commerciali
- Usare gli indicatori nella pratica
- Chiusura
1. Cos'è la liquidità?
La liquidità è, semplicemente, la quantità di denaro disponibile nel sistema finanziario. Più denaro c'è in circolazione, più capitale può essere investito.
Quel denaro può finire nelle case, nelle azioni, nell'oro, in Bitcoin - e in generale in qualsiasi asset. Maggiore è la liquidità disponibile, maggiore è la probabilità che il valore degli asset continui a crescere.
Lo stesso vale per beni e servizi: quando nel sistema circola più denaro, anche il loro prezzo tende ad aumentare. È il fenomeno che conosciamo come inflazione.
2. Perché quasi tutti gli asset salgono nel lungo periodo?
Se osserviamo i grafici di lungo periodo dei principali asset, notiamo una caratteristica comune: sono quasi tutti in trend rialzista. Qui sotto alcuni esempi.
Non è una coincidenza. Nel tempo, la quantità di denaro presente nel sistema continua ad aumentare, e quel denaro prima o poi viene investito. Per questo, su orizzonti sufficientemente lunghi, la maggior parte degli asset tende ad aumentare di valore.
Naturalmente ci saranno periodi di ribasso, anche molto violenti. Ma il trend di lungo periodo è influenzato da un fattore molto semplice: la liquidità.
3. Come possiamo misurare la liquidità?
Sapere che la liquidità è importante è semplice. Capire quanta liquidità è presente oggi è altrettanto semplice. Prevedere quanta liquidità potrebbe essere immessa nei mercati nei prossimi mesi, invece, è molto più difficile.
Per misurarla esistono diversi aggregati monetari:
- M0
- M1
- M2
- M3
Più il numero è basso, più il denaro è immediatamente disponibile; più è alto, più comprende forme di denaro meno liquide. La M0 è la forma più liquida, la M3 include anche strumenti meno liquidi. In questo articolo ci concentriamo sulla M2 - l'aggregato più usato per misurare la liquidità nell'economia, che storicamente ha mostrato una buona relazione con gli asset di rischio.
4. La M2: il carburante dei mercati nel lungo termine
La M2 comprende il contante in circolazione, i depositi a vista (conti correnti), i depositi a risparmio, i piccoli depositi a termine e i fondi comuni monetari retail.
La liquidità in circolazione aumenta nel tempo. È una delle ragioni di fondo per cui, sul lungo periodo, gli asset tendono a salire - la stessa ragione per cui beni e servizi costano sempre di più: l'inflazione.
5. I due motori della liquidità
Se la liquidità è così importante, cosa la fa aumentare o diminuire? Esistono due grandi motori. Il primo è la Federal Reserve, la banca centrale degli Stati Uniti. Il secondo sono le banche commerciali.
La Fed influenza la liquidità attraverso la politica monetaria; le banche commerciali attraverso il credito. Quando entrambi spingono nella stessa direzione, la liquidità può aumentare molto rapidamente. Quando entrambi rallentano insieme, tende a contrarsi.
6. La Federal Reserve
La Federal Reserve influenza la liquidità principalmente attraverso 4 strumenti:
- Fed Funds Rate
- Fed Balance Sheet (WALCL)
- Net Liquidity
- Riunioni FOMC & Dot Plot
1) Fed Funds Rate
Il Fed Funds Rate è il tasso di riferimento fissato dalla Federal Reserve - probabilmente il dato macro più seguito dai mercati. Quando i tassi vengono abbassati, prendere denaro in prestito costa meno e famiglie e imprese tendono a spendere e investire di più; quando vengono alzati, il denaro diventa più costoso e l'economia rallenta. Ma c'è un aspetto ancora più importante: i mercati non aspettano le mosse della Fed, cercano di anticiparle. Per questo le aspettative future sui tassi sono spesso più importanti della decisione presa nel presente.
2) Fed Balance Sheet (WALCL)
Il secondo indicatore è il bilancio della Fed (WALCL), il valore totale degli asset che detiene. Quando aumenta, la Fed sta comprando asset e immettendo liquidità - il Quantitative Easing (QE). Quando diminuisce, sta riducendo la liquidità - il Quantitative Tightening (QT). È uno degli indicatori più diretti per capire se la banca centrale sta espandendo o contraendo la liquidità.
3) Net Liquidity
Il bilancio, però, non racconta tutta la storia. Per capire quanta liquidità è realmente disponibile ai mercati si usa spesso la Net Liquidity:
Il TGA (Treasury General Account) è il conto del governo americano presso la Fed: quando il suo saldo aumenta, una parte della liquidità viene temporaneamente parcheggiata e smette di circolare. Il Reverse Repo (RRP) è lo strumento con cui fondi monetari e istituzioni depositano liquidità presso la Fed in cambio di un rendimento a breve - anch'essa temporaneamente sottratta ai mercati. Per questo la Net Liquidity è una misura più realistica: il bilancio è liquidità "lorda", la Net Liquidity è quella realmente utilizzabile dai mercati.
4) Riunioni FOMC & Dot Plot
Oltre ai grafici, esistono eventi che influenzano la liquidità - i più importanti sono le riunioni del FOMC. Dopo ogni riunione la Fed pubblica la decisione sui tassi, il comunicato ufficiale, le proiezioni economiche e il Dot Plot (le aspettative dei membri sull'andamento futuro dei tassi). Permettono di capire come la banca centrale vede l'economia e le prossime mosse. Si consultano dal calendario ufficiale: federalreserve.gov.
7. Le banche commerciali
La Fed non è l'unico motore della liquidità - anche le banche commerciali svolgono un ruolo fondamentale. Ogni volta che una banca concede un prestito, viene creato un nuovo deposito; in altre parole, viene creata nuova M2. Quando il credito cresce, aumenta la liquidità; quando le banche riducono i prestiti, la crescita della M2 rallenta. Per capire cosa fanno le banche possiamo osservare alcuni indicatori.
1) Fed Funds Rate
Anche per le banche commerciali i tassi sono fondamentali. Quando il costo del denaro diminuisce, concedere prestiti diventa più semplice e la domanda di credito tende ad aumentare - di conseguenza cresce anche la liquidità.
2) TOTBKCR
Il TOTBKCR misura il credito totale erogato dalle banche commerciali - uno degli indicatori più diretti per capire se il credito sta aumentando o rallentando. Se cresce, le banche stanno creando nuova liquidità; se rallenta o diminuisce, il motore del credito perde forza. Qui sotto è mostrato con l'indicatore ROC per misurare la variazione anno su anno.
3) Senior Loan Officer Survey (SLOOS)
Lo SLOOS è un sondaggio trimestrale della Federal Reserve: le banche indicano se stanno rendendo più facile o più difficile concedere nuovi prestiti a famiglie e imprese. Se gli standard si allentano, credito e liquidità spesso migliorano nei mesi successivi; se si irrigidiscono, credito e crescita della M2 tendono a rallentare. In passato non ha avuto un'alta correlazione con BTC, ma è utile per monitorare il ciclo del credito.
4) Credit Spread
I Credit Spread misurano la differenza di rendimento tra obbligazioni rischiose e obbligazioni sicure. Quando si restringono, il mercato è più propenso al rischio e il credito fluisce più facilmente; quando si allargano, aumenta lo stress finanziario e il credito rallenta. Sono un ottimo termometro dello stato di salute della liquidità.
8. Come usare gli indicatori nella pratica
Personalmente credo sia molto difficile ottenere un vantaggio usando la sola liquidità per prevedere i movimenti di Bitcoin nel breve periodo (meno di tre mesi) - nel breve esistono molti altri fattori che influenzano il prezzo. Non uso la liquidità per prevedere le prossime settimane. Credo però sia fondamentale capire in quale fase del ciclo della liquidità ci troviamo.
La liquidità è uno dei principali fattori macro che influenzano Bitcoin e gli asset di rischio. Allo stesso tempo, in passato i bull market non sono necessariamente iniziati quando la Fed ha abbassato i tassi o avviato il QE - anzi, spesso Bitcoin ha anticipato questi trend. Nonostante ciò, è fondamentale essere consapevoli del contesto monetario. L'obiettivo è capire se il vento macro sta iniziando a soffiare a favore o contro gli asset di rischio.
9. Chiusura
La liquidità, da sola, non basta per prevedere i movimenti di Bitcoin. Nel breve periodo il prezzo può essere influenzato da decine di fattori: sentiment, eventi macro, notizie, posizionamento degli investitori e molto altro. Sul lungo periodo, però, comprendere la direzione della liquidità è uno degli strumenti più utili che un investitore possa avere. Per questo monitoro costantemente questi indicatori.
Inoltre, Bitcoin sta diventando un asset sempre più istituzionale e, di conseguenza, sempre più influenzato dai fattori macro. Ad oggi nessun indicatore della liquidità ha mostrato una correlazione perfetta con Bitcoin in ogni fase di mercato. Ma credo che, con gli anni, la liquidità diventerà un fattore sempre più importante per l'asset - ed è anche per questo che continuo a monitorare con attenzione gli strumenti visti in questo articolo.